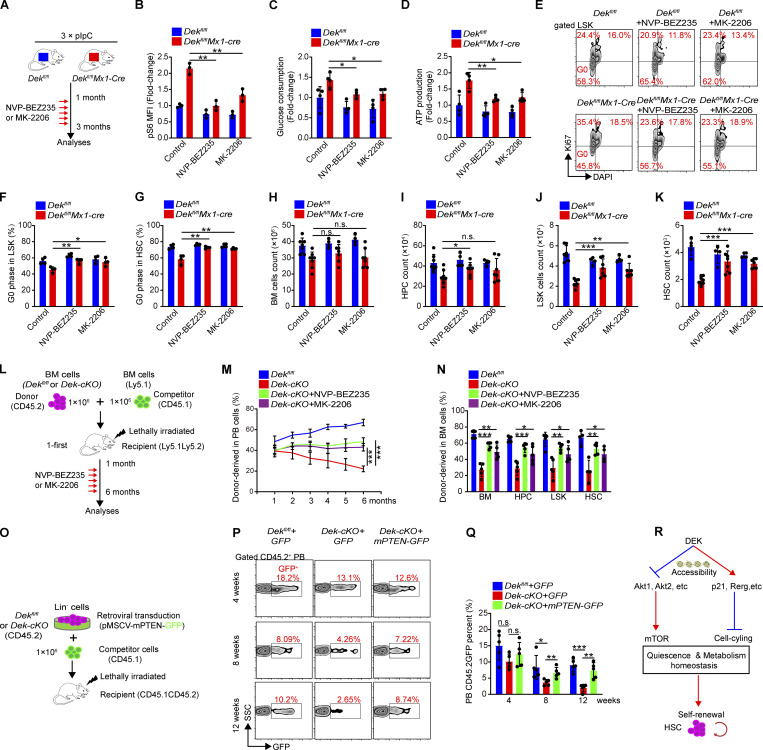
Figure 6.
Targeting the Akt-mTOR pathway partially rescues Dek-cKO defective HSCs. (A) Experimental schematic for administration of PI3K-mTOR pathway inhibitors. 1 mo after pIpC injection, Dekfl/fl and Dekfl/flMx1-Cre mice were orally gavaged with NVP-BEZ235 or MK-2206 for 2 mo. (B) FACS and mean fluorescence intensity (MFI) analysis of p-S6 in HSCs of Dekfl/flMx1-Cre mice at 2 mo after inhibitor treatment (n = 3). (C) Glucose consumption of LSK cells sorted from the indicated mice. Cells were cultured in vitro for 24 h and the change in glucose concentration in the culture medium was measured (n = 4). (D) ATP level in freshly sorted HSCs (n = 4). (E) FACS analysis of Ki-67 + DAPI staining in LSK cells. (F and G) G0 phase analysis of LSK cells and HSCs in mice (n = 4). (H–K) BM cell, HPC, LSK cell, and HSC count in mice BM (n = 4–8). (L) Experimental schematic for the competitive transplantation assay. BM cells of Dekfl/fl and Dek-cKO mice were transplanted into lethally irradiated recipient mice with competitor BM cells from WT Ly5.1 mice. Recipient mice were subjected to inhibitor treatment at 1 mo after transplantation. The reconstituted BM cells of recipient mice were harvested (at 6 mo after transplantation) for analysis. (M) Percentage of donor-derived PB cells at the indicated time points in competitive transplantation assay (n = 4–5). (N) Percentage of donor-derived BM cells, HPCs, LSK cells, and HSCs at 6 mo after first transplantation (n = 4–5). (O) Experimental schematic for competitive transplantation assay. Lin− cells were freshly isolated from mice and subjected to retroviral transduction to enforce the expression of PTEN with GFP fluorescence. (P) FACS analysis of GFP+ cells in donor-derived PB cells of recipient mice. (Q) Contribution of retrovirally transduced donor cells (CD45.2+GFP+) to recipient mouse PB cells after primary transplantation (n = 5). (R) Proposed model demonstrating the role and underlying mechanisms of DEK regulating quiescence and metabolic hemostasis, and self-renewal of HSCs. Error bars represent means ± SD. *, P < 0.05; **, P < 0.01; ***, P < 0.001; one-way ANOVA. Data are representative of three independent experiments.

