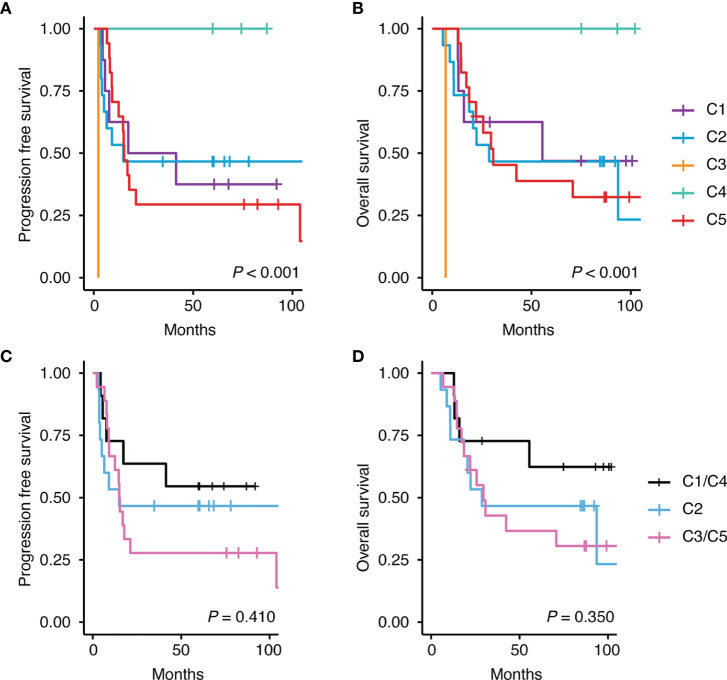
Figure 11.
Differences in survival according to the classification of Chapuy et al. (9). Kaplan-Meier curves shows the difference in survival rate according to each class for (A) progression free survival and (B) overall survival. C1 and C4 were reported to have good prognosis and C3 and C5 were reported to have poor prognosis. This trend was also seen in our data on (C) progression free survival and (D) overall survival.

