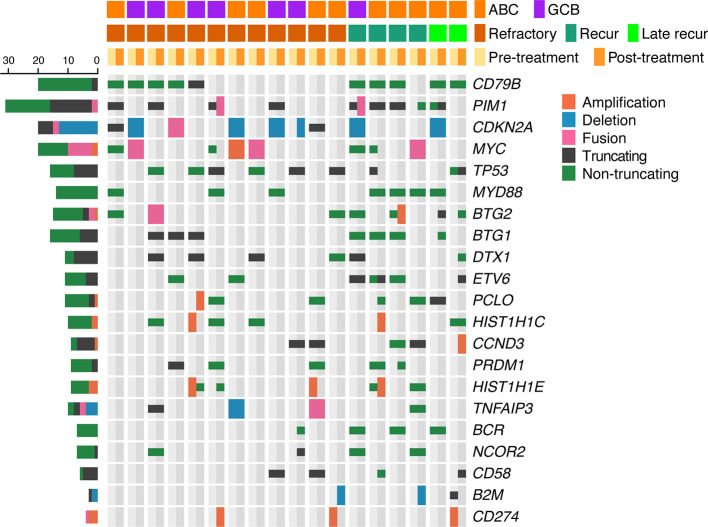
Figure 8.
Mutational profiles of 18 paired pretreatment and post-treatment rrDLBCL samples. Genes mutated in > 3 cases are shown. The genes are ordered by the frequency of mutation. Unlike the Figure 3, copy numbers > 4 are marked as amplifications. COO, cell of origin; ABC, activated B-cell-like subtype; GCB, germinal center B-cell-like subtype.

