
Fig. 1.
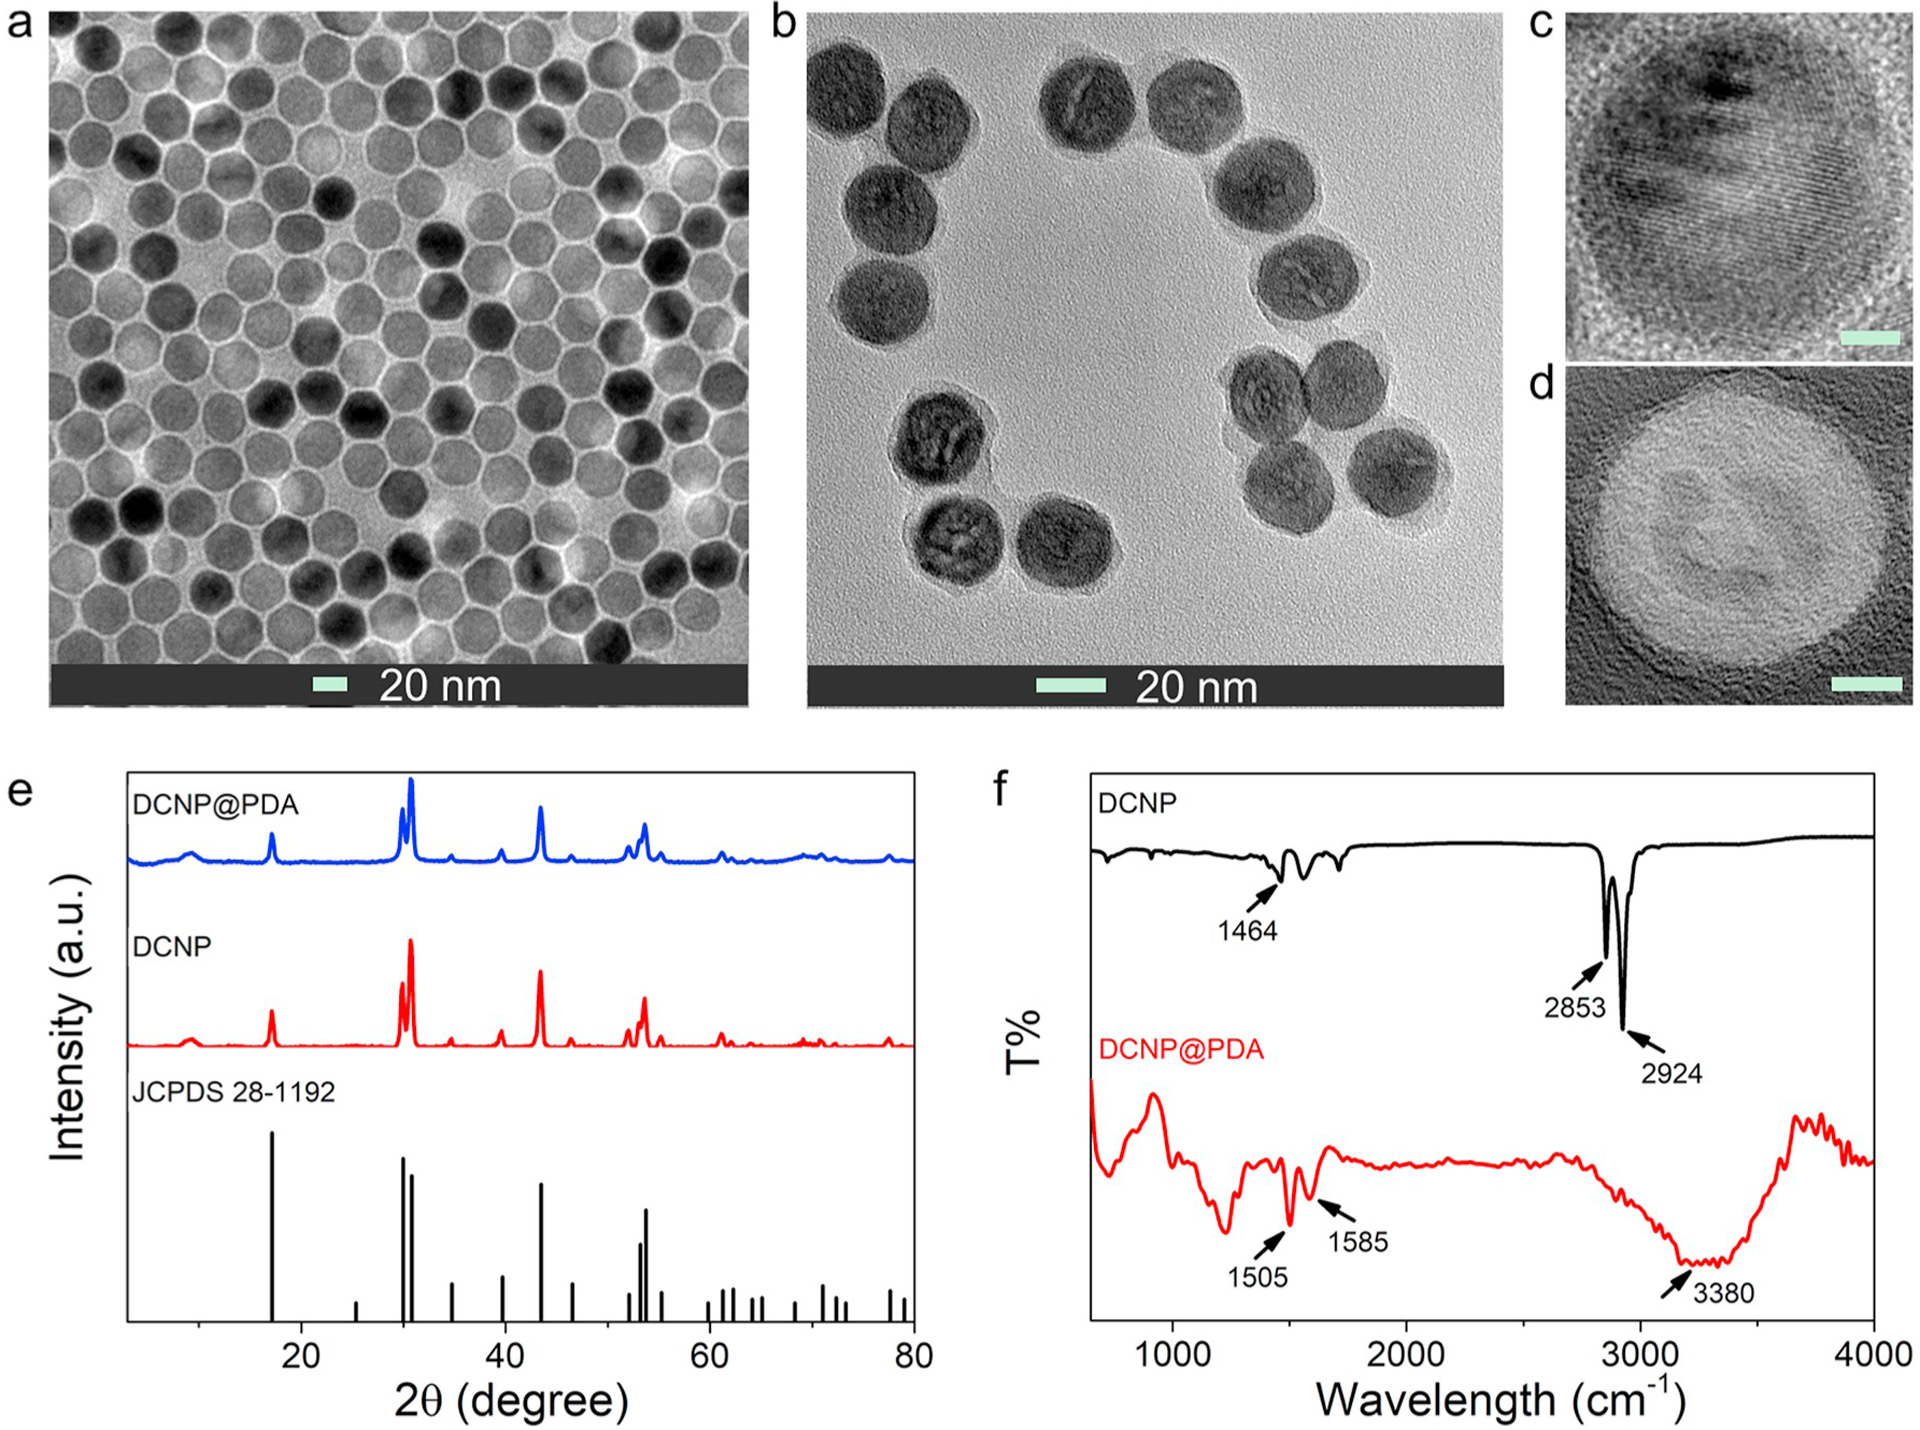
TEM images of (a) NaYF4:Yb3+,Er3+@NaYbF4@NaYF4:Nd3+ core@shell@shell DCNPs and (b) DCNP@PDA NPs. The corresponding HRTEM images of (c) DCNPs and (d) DCNP@PDA NPs, respectively. The scale bars are 5 nm. (e) XRD patterns of DCNPs and DCNP@PDA NPs, respectively. (f) FTIR spectra of DCNPs and DCNP@PDA NPs, respectively.