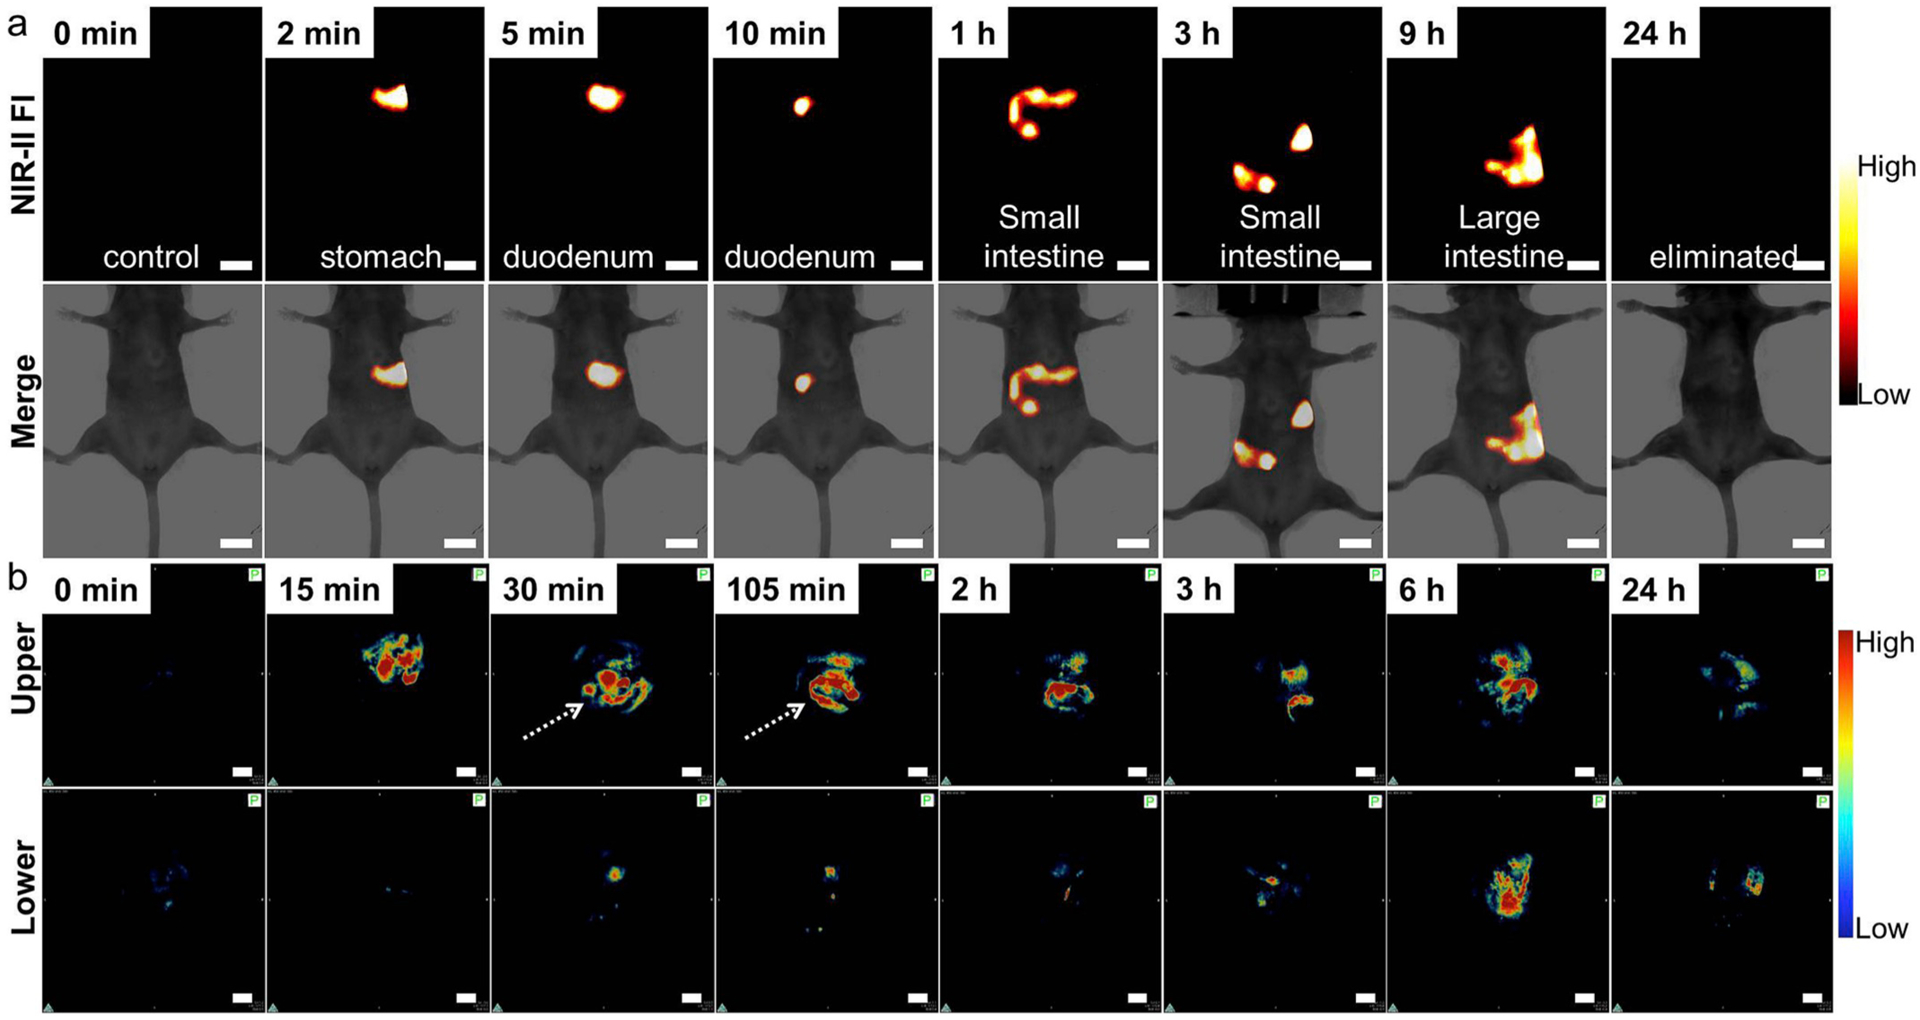
Fig. 3.

(a) In vivo NIR-II FI for GI tract of the BALB/c nude mouse at different time intervals after oral gavage of DCNP@PDA NPs under 808 nm CW laser irradiation and 1000 ms imaging exposure time. (b) In vivo PAI for GI tract of upper section and corresponding lower section of the BALB/c nude mouse at different time intervals after oral gavage of DCNP@PDA NPs. Scale bars are 10 mm.
