. 2019 Feb 28;31(2):133–138. doi: 10.5021/ad.2019.31.2.133

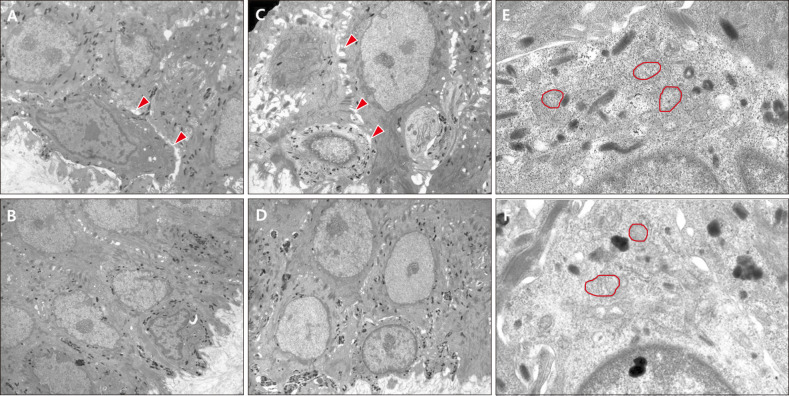
Fig. 2. (A~D) Transmission electron microscope images of the epidermis layer (×3,000). (A) and (C) are images of the epidermis after combination therapy. (B) and (D) are images of the epidermis after toning therapy. Red arrowheads show loosening of melanocytes and adjacent epidermal cells. Images (A) and (C) show increased loosening of melanocytes and adjacent epidermal cells. Shrinkage of the melanocyte cytoplasm was found after both treatment modalities. (E) and (F) are images of micro-organelles in the melanocytes after both treatment modalities. The mitochondrias (red circles) were more edematous and the number of micro-vesicles was greater after combination therapy (E) than toning alone (F) (×6,000).

Fig. 2