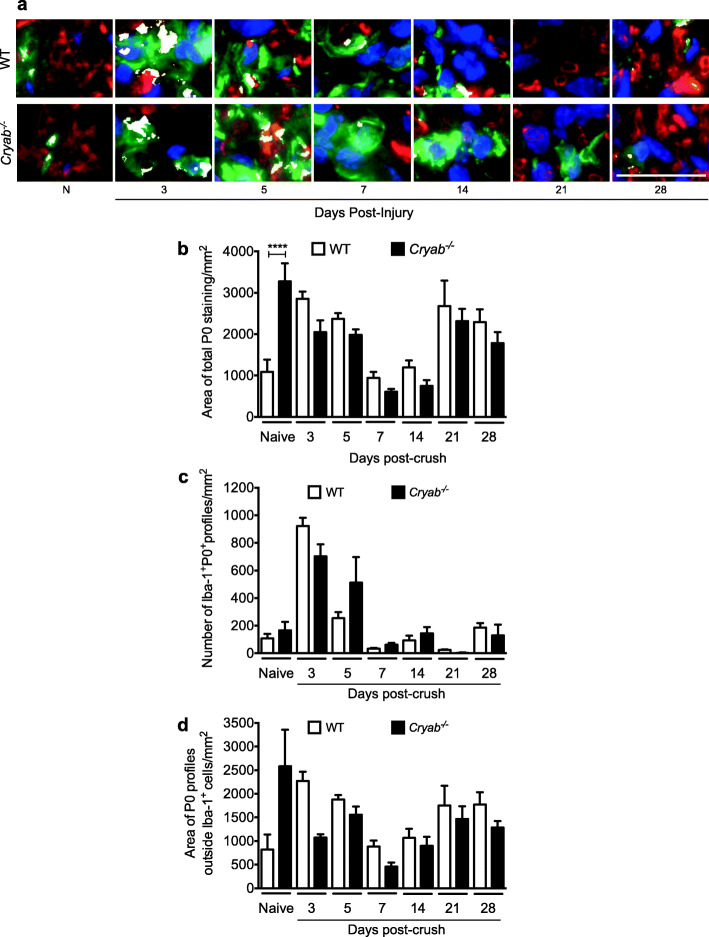
Fig. 2.
Presence of P0+ myelin within and outside of Iba1+ DAPI+ cells. a Representative images of colocalization (white) of Iba1+ cells (green), P0+ staining (red), and DAPI+ (blue) in sciatic nerves from naïve and 3, 5, 7, 14, 21, and 28 days post-crushed WT and Cryab−/− mice, bar = 20 μm. b, c Quantification of the total area of P0 staining (b), number of Iba1+ DAPI+ P0+ profiles (c), and area of P0 staining outside of Iba1+ DAPI+ cells (d) in sciatic nerves from naïve and injured WT (white bars) and Cryab−/− (black bars) animals; n=3–7 animals/group, data represent mean ± sem, *p< 0.05 independent t-test

