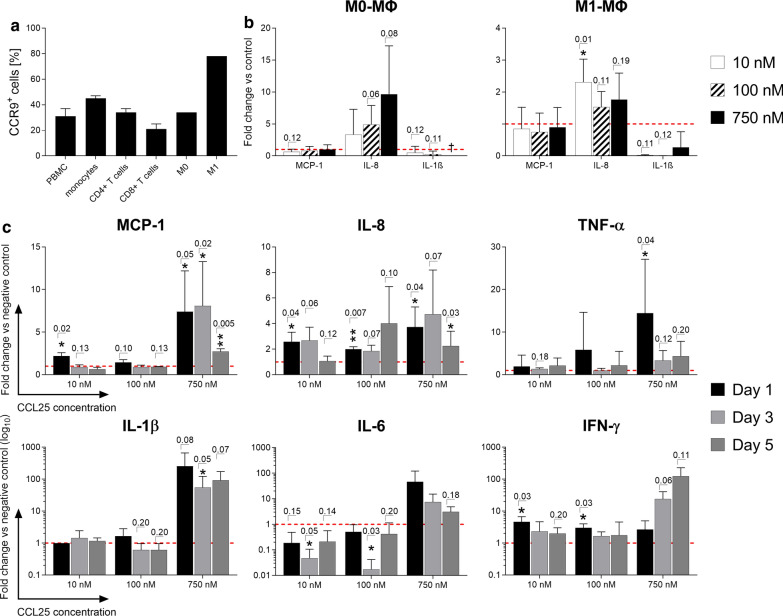
Fig. 1.
CCR9 expression and secretion profile of immune cell subsets after stimulation with CCL25. PBMCs, unpolarized (M0) and polarized macrophages (M1) were stained with a CCR9-specific antibody and analyzed by flow cytometry. PBMCs and macrophages were stimulated with different dosages of CCL25 or left unstimulated as a negative control. A LEGENDplex cytokine array was performed using the culture supernatants after day 1, day 3 and day 5. a The expression of the CCL25-receptor CCR9 on different immune cell subsets is shown as mean of the percentage of marker positive cells + SD (n = 1–4). b Shown are the cytokine/chemokine release data for M0 and M1 macrophages after one-day stimulation with 10, 100 and 750 nM CCL25 as the mean fold change + SD compared to the negative control (red dotted line) (n = 4). c The cytokine/chemokine release data for PBMCs stimulated with 10, 100 and 750 nM CCL25 over three days are displayed as the mean fold change + SD normalized to the negative control (red dotted line) (n = 3). Significance was analyzed using either a student’s T-test or the Mann–Whitney-U test depending on whether data followed normal distribution. Individual p-values are given above the bars if lower than p = 0.20. PBMCs:peripheral blood mononuclear cells, ΜΦ Macrophages

