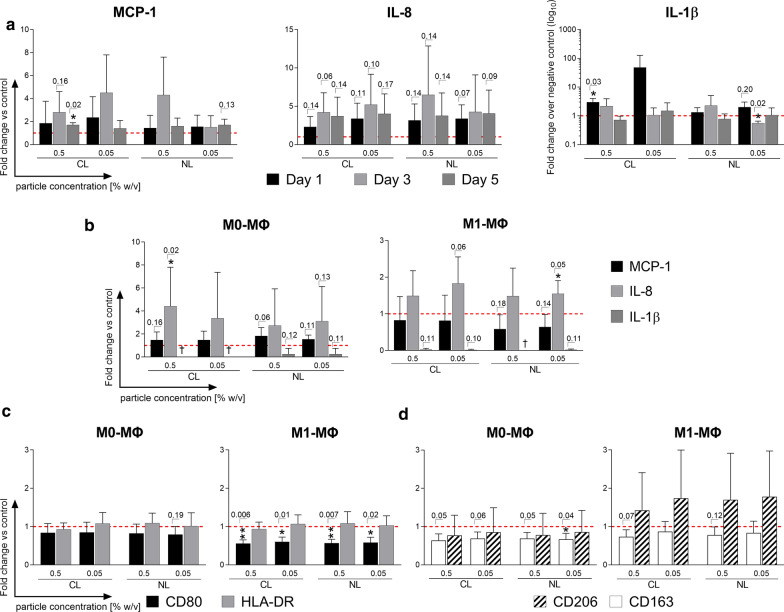
Fig. 3.
Response profile of immune cell subsets after stimulation with CCL25-loaded/unloaded PLGA particles. PBMCs and macrophages were stimulated with CCL25-loaded (CL) and unloaded (NL) PLGA particles at two different concentrations (0.5% w/v and 0.05% w/v). Induced changes in the cytokine/chemokine secretion profiles of PBMCs and macrophages were analyzed with a LEGENDplex cytokine array. In addition, unpolarized M0 macrophages and polarized M1 macrophages were stained for characteristic surface markers with fluorescently labeled antibodies and measured by flow cytometry to analyze their polarization status. a Cytokine release data (IL-8, MCP-1, IL-1) of PBMCs stimulated with 0.5% w/v and 0.05% w/v of CL and NL PLGA particles over 5 days are shown as mean fold change + SD normalized to the negative control (red dotted line) (n = 3). b Cytokine release data (IL-8, MCP-1, IL-1) of M0/M1 macrophages stimulated with 0.5% w/v and 0.05% w/v of CL and NL PLGA particles over 1 day are shown as the mean fold change + SD normalized to the negative control (red dotted line) (n = 4). Surface expression levels of M0 (left) and M1 (right) macrophages for the characteristic M1 polarization markers CD80 and HLA-DR (c) and for M2 polarization markers CD206 and CD163 (d) after stimulation with 0.5% w/v and 0.05% w/v of CL and NL PLGA particles over 1 day are displayed as mean of the fold change + SD normalized to the control (red dotted line), (n = 4). Statistical analysis was performed using either a student’s T-test or the Mann–Whitney-U test depending on whether data showed normal distribution. Individual p-values are given above the bars if they are lower than p = 0.20. CL CCL25-loaded, NL non-loaded, PC Particle concentration., w/v weight per volume, ΜΦ Macrophages

