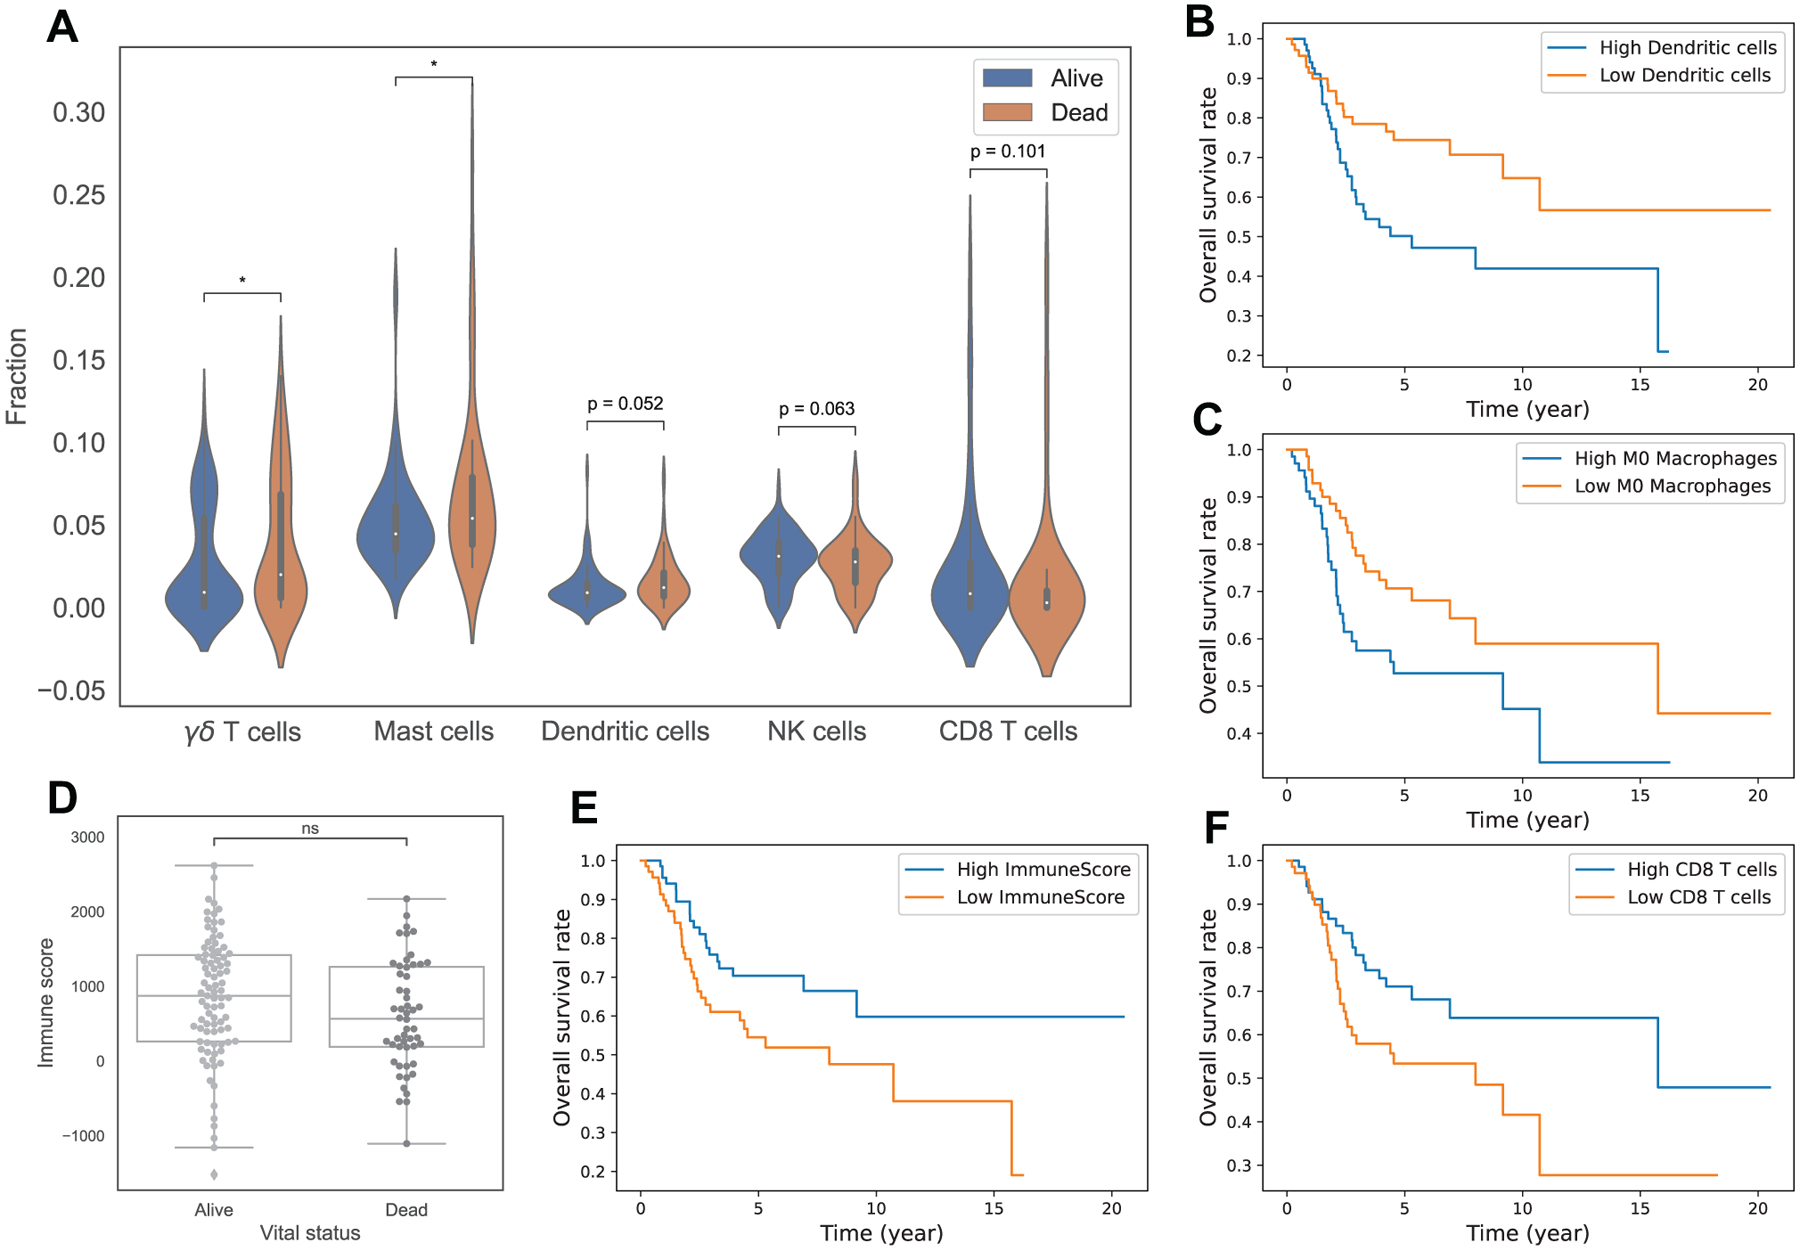
Figure 3.

Relationship of immune infiltrations with survival in osteosarcoma. Sub-figure A displays violin plots of fractions of γδ T cells, Mast cells, Dendritic cells, NK cells, CD8 T cells between alive and dead patients. Sub-figures B, C, E, F show Kaplan-Meier curves of overall survival between 2 groups, B: high vs low Dendritic cells, C: high vs low M0 Macrophages, E: high vs low ESTIMATE immune score, F: high vs low CD8 T cells. Sub-figure D shows a boxplot of ESTIMATE immune scores between alive and dead patients. Note: asterisks indicate significant difference from Mann-Whitney-Wilcoxon test (ns: no significance, *: 0.01 < p ≤ 0.05, **: 0.001 < p ≤ 0.01, ***: 0.0001 < p ≤ 0.001, ****: p ≤ 0.0001).
