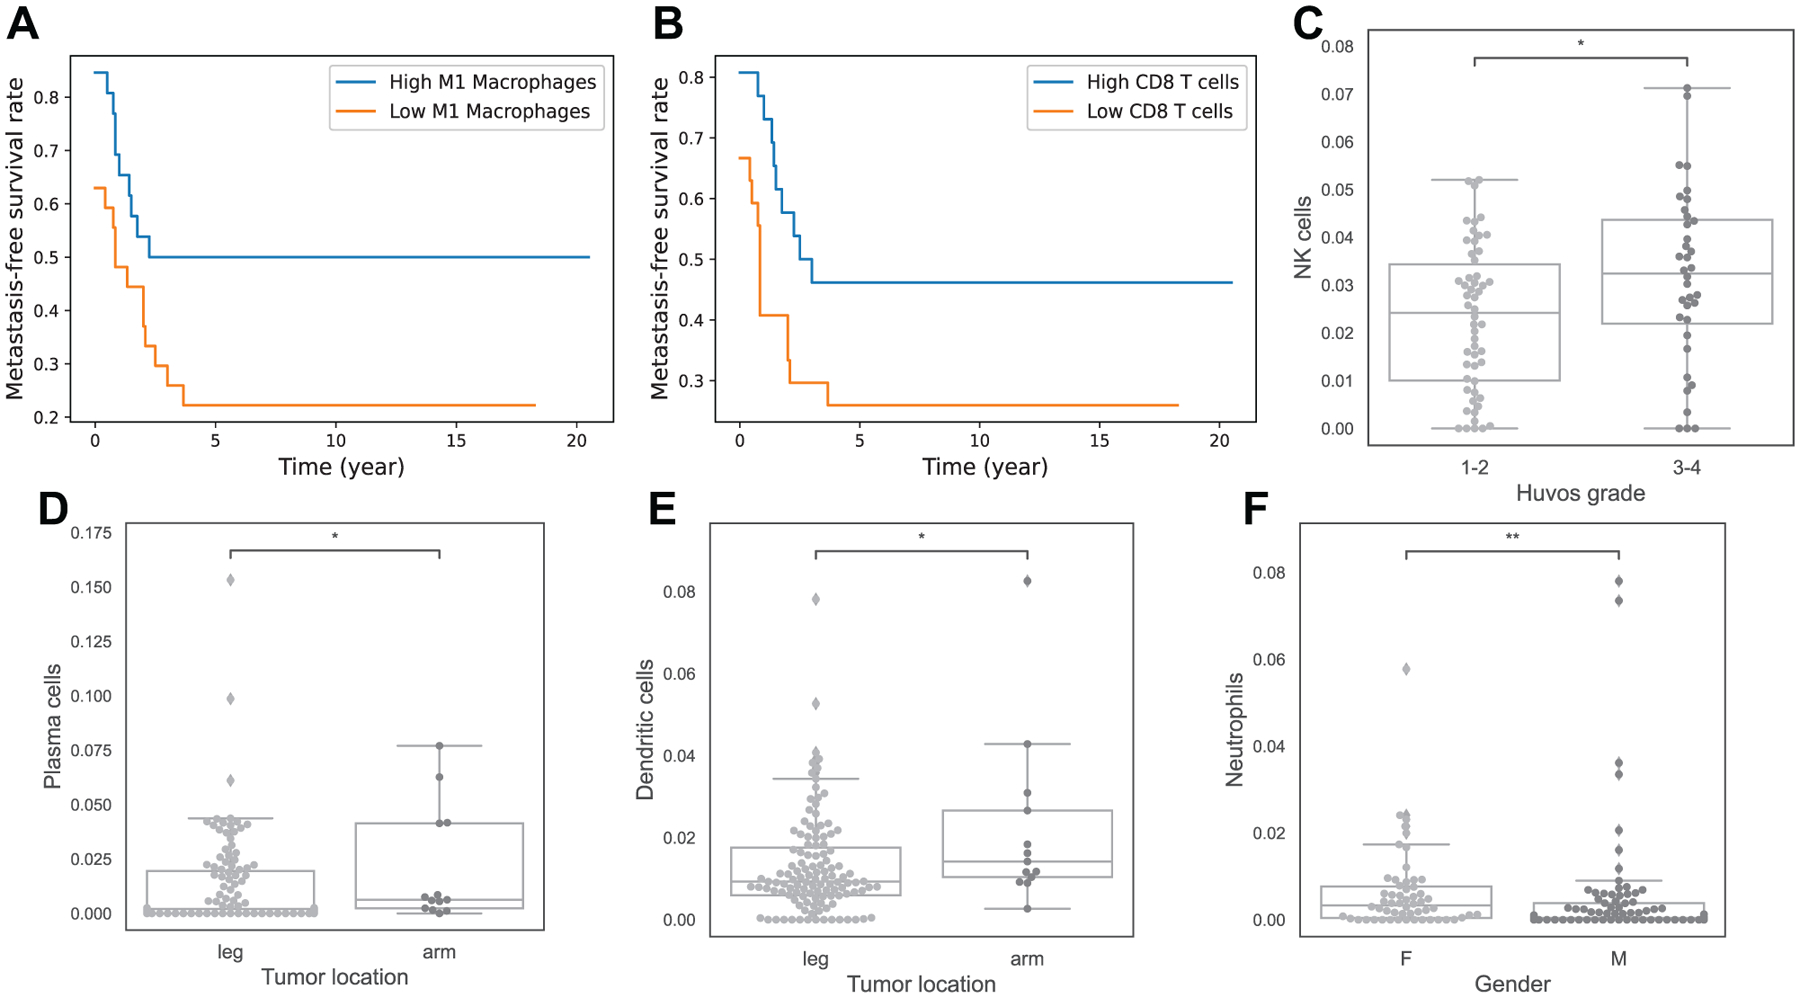
Figure 4.

Association of immune infiltrations and other clinical features. Sub-figures A and B show Kaplan-Meier curves of metastasis-free-survival in cohort 1 between 2 groups, A: high vs low M1 Macrophages, B: high vs low CD8 T cells. Sub-figures C-F are boxplots to indicate relationship of immune infiltrates with Huvos grade (C), primary tumor location (D and E), and gender (F). Note: asterisks indicate significant difference from Mann-Whitney-Wilcoxon test (ns: no significance, *: 0.01 < p ≤ 0.05, **: 0.001 < p ≤ 0.01, ***: 0.0001 < p ≤ 0.001, ****: p ≤ 0.0001).
