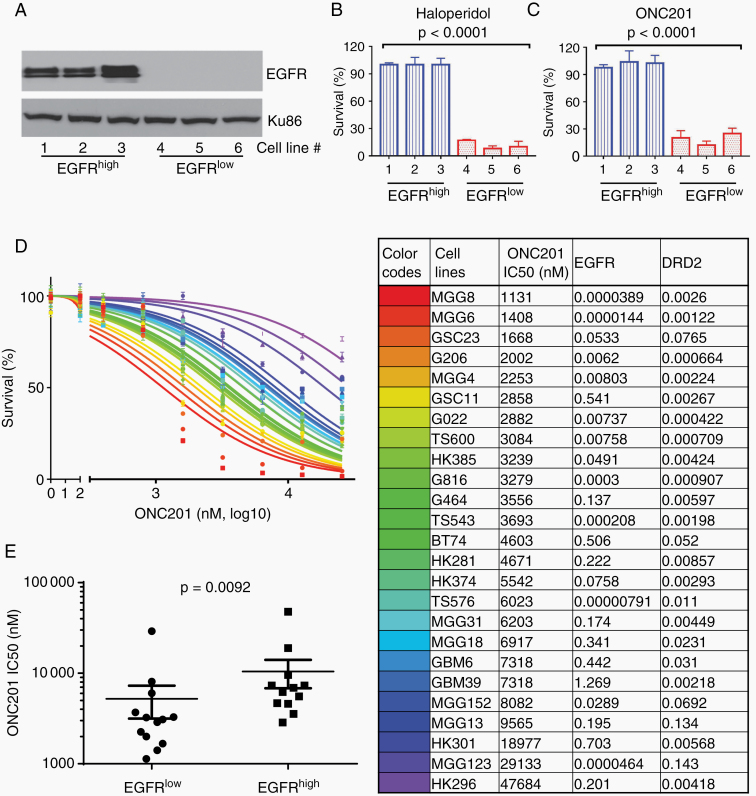
Fig. 2.
PDX lines with low EGFR expression are sensitive to DRD2 inhibitors in vitro. (A) Western blots showing EGFR expression in 6 different PDX lines. (B, C) Survival fractions of the PDX lines in response to 20 µM of haloperidol (B) and 10 µM of ONC201 (C). (D) Dose response curves of the second panel of 25 glioblastoma neurosphere cell lines to ONC201. The 6 cell lines studied in the first panel were not included in this second panel of 25 lines (left panel). The colors in the graph correspond to the cell lines listed in a table on the right panel. Half-maximal inhibitory concentration (IC50) for ONC201, and relative transcription levels of EGFR and DRD2 measured by qRT-PCR in each cell line (right panel). (E) IC50 for ONC201 in EGFRlow and EGFRhigh glioblastoma PDX lines.

