Fig. 5.
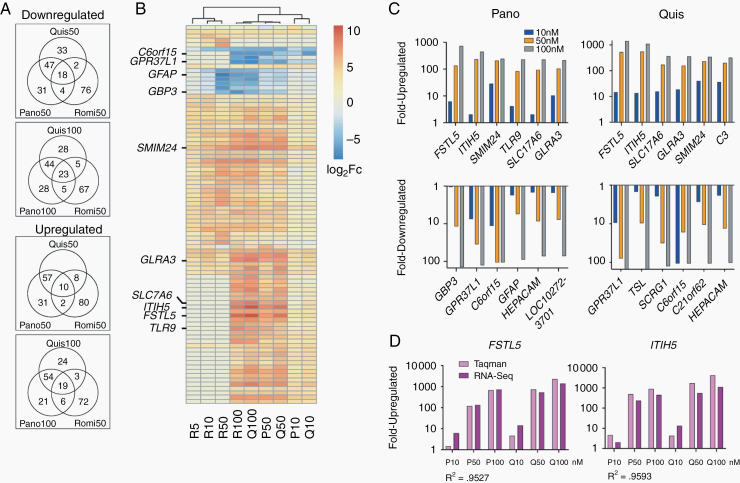
Transcriptomic studies reveal targets of cytotoxic HDAC inhibition. (A) Venn diagrams show the overlap between the 100 most up and downregulated genes for quisinostat, panobinostat, and romidepsin treated PBT-22FH cells relative to vehicle control. Comparisons are shown for equimolar treatment (50 nM) or 50 nM romidepsin versus 100 nM quisinostat and panobinostat. (B) Unsupervised hierarchical clustering of the union of the top 500 most differentially regulated genes, displaying union of top 20 for each treatment (87 genes total). (C) Modulation of expression levels with drug concentration for top 6 differentially up- and downregulated genes following panobinostat and quisinostat treatment. (D) TaqMan PCR validation of expression changes in FSTL5 and ITIH5, compared with RNA-seq (R2 = Pearson coefficient).

