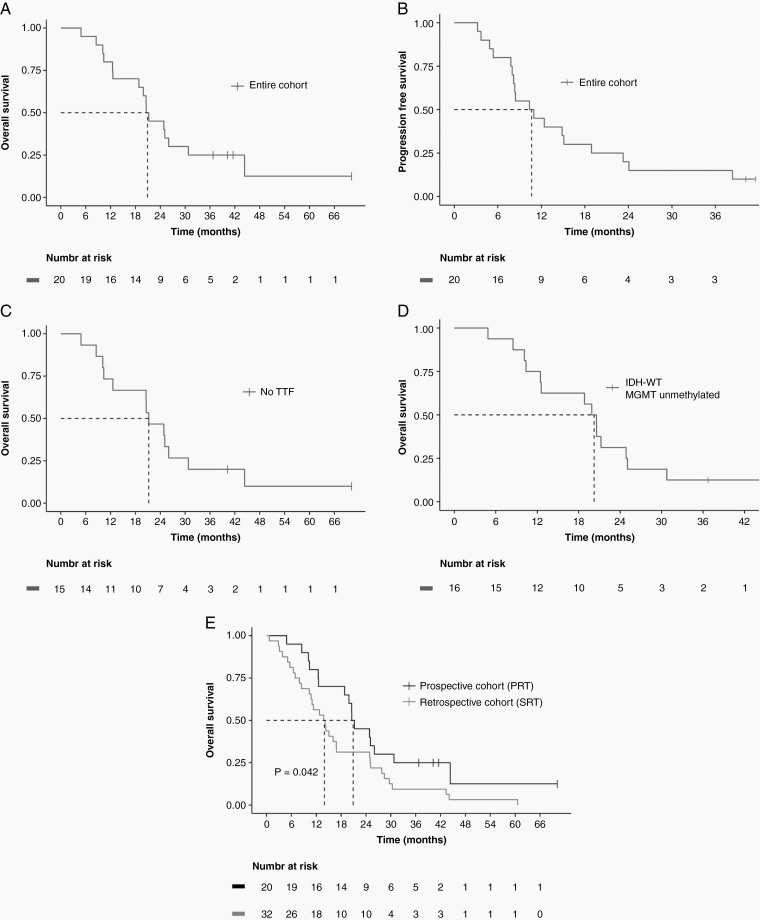
Fig. 1.
Kaplan–Meier survival curves. (A) mOS was 20.9 months with an estimated 2-year OS of 45% for the entire cohort. (B) Median PFS was 10.7 months for the entire cohort. (C) mOS was 21.2 months for patients not treated with tumor-treating fields. (D) mOS was 20.2 months for patients with IDH-WT and MGMT unmethylated tumors. (E) Survival was significantly higher in the prospective cohort patients treated with PRT compared with a matched retrospective cohort treated with SRT (mOS 20.9 vs 14.0 months, P = 0.042). Dashed lines indicate mOS or mPFS.

