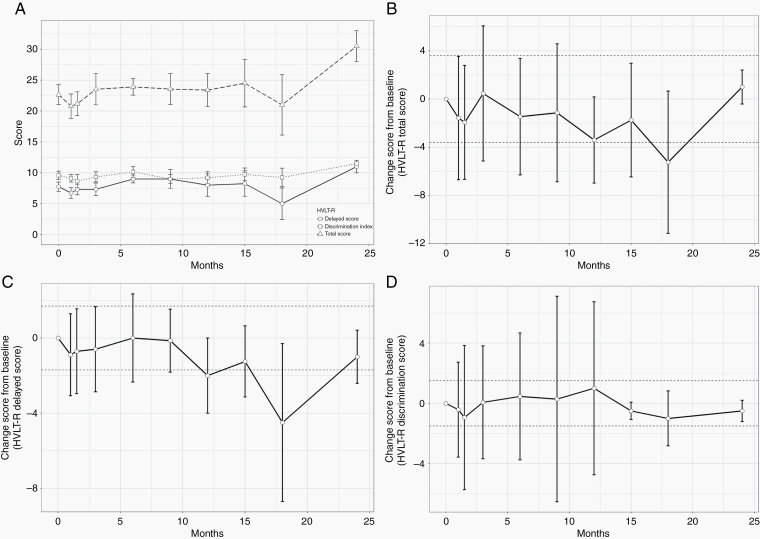
Fig. 2.
Results of Hopkins Verbal Learning Test-Revised testing. Results are presented at baseline and at each follow-up for the first 2 years for all patients who had not developed tumor progression at each time point. All results are presented as mean ± standard deviation. (A) Raw values of the HVLT-R scores. (B–D) Changes in the HVLT-R total recall, delayed recall, and recognition discrimination index scores, respectively. The dashed lines represent the MCID threshold. Error bars crossing the MCID line indicate no significant change from baseline.

