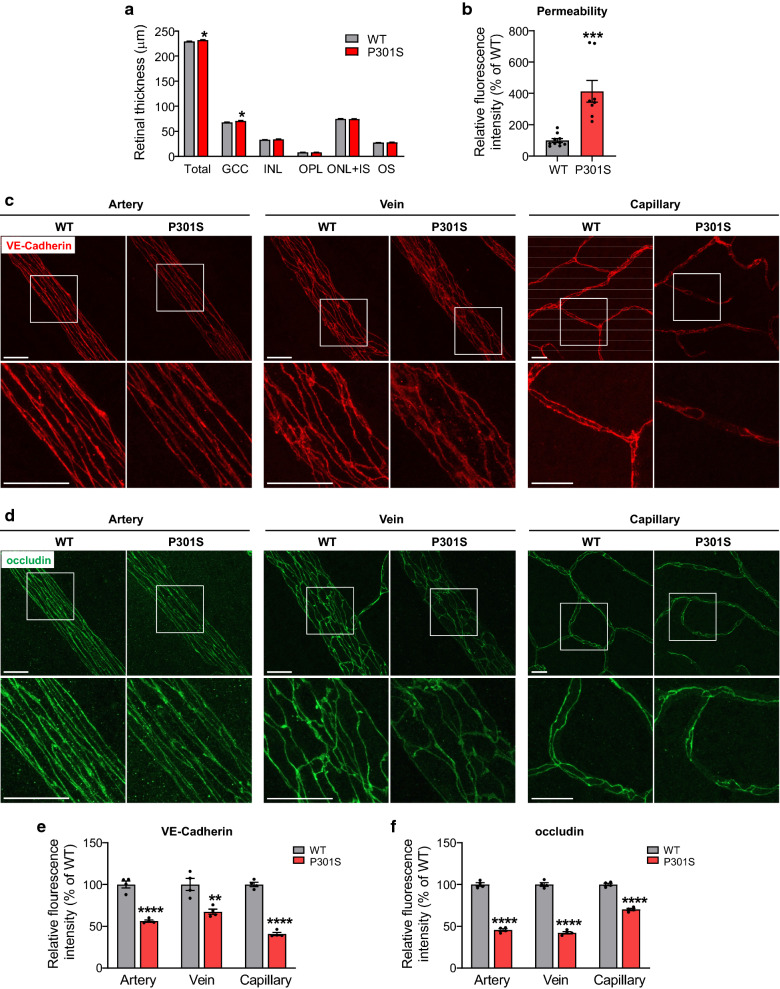
Fig. 2.
Blood–retina barrier integrity is impaired in the retina of P301S mice. a Bar graph represents the OCT analysis of thickness of total retina and individual retinal layers. n = 22/group. b Permeability assay. FITC-BSA was intravenously injected into 1-month-old WT and P301S mice. 1 h after injection, blood from circulation was removed by PBS perfusion, and albumin leakage from vessels to neuronal retina was measured by quantifying the fluorescence intensity in retinal homogenates and normalized to that of in the plasma. The normalized fluorescence intensity in WT mice was used as the reference. n = 8–10/group. c, d Representative images of the adherens junction protein VE-Cadherin and tight junction protein occludin in retinal flatmounts from WT and P301S mice at 1 month of age. Squares in the upper panel of images are zoomed in to show vascular integrity. Scale bar: 20 μm. n = 4/group. e, f Quantification of fluorescence intensity of VE-Cadherin and occludin. *p < 0.05; **p < 0.01; ***p < 0.001; ****p < 0.0001 versus WT. GCC ganglion cell complex, including all three innermost layers: nerve fiber layer, ganglion cell layer and inner plexiform layer, INL inner nuclear layer, OPL outer plexiform layer, ONL outer nuclear layer, IS inner segment, OS outer segment

