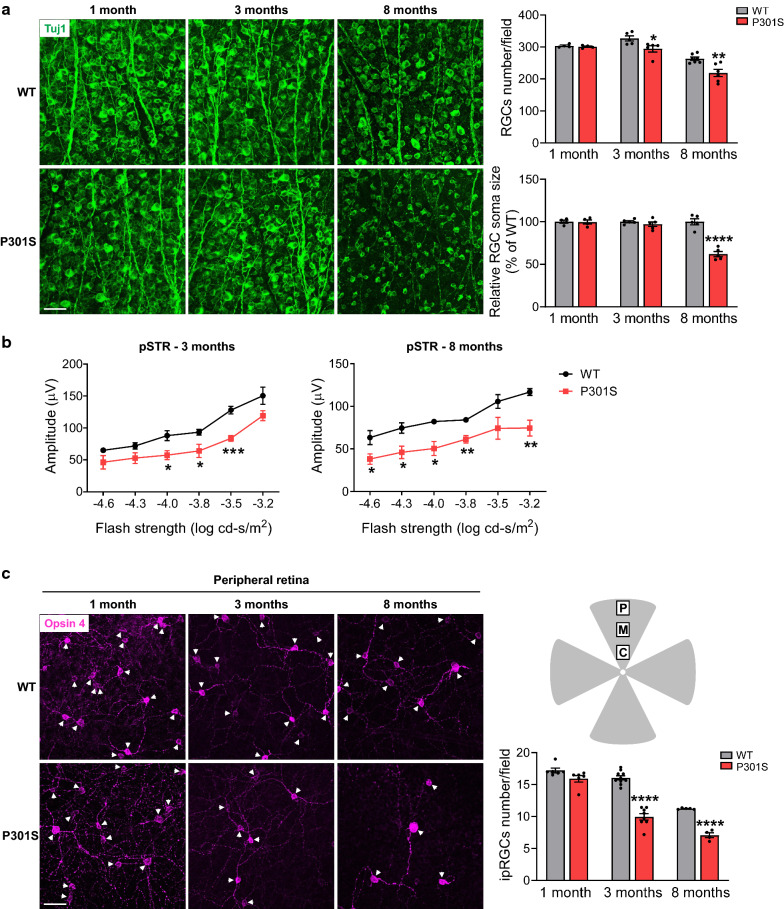
Fig. 4.
RGCs and ipRGCs are impaired in the retina of P301S. a RGCs were stained with anti-Tuj1 antibody (green) in retinal flatmounts from WT and P301S mice at 1, 3 and 8 months of age. Bar graphs represent the number and soma size of RGCs per field. n = 4–7/group, eight images were taken at the peripheral retina for each sample and calculated as average value. b ERG analysis (pSTR) over a range of stimulus strengths in WT and P301S mice at 3 and 8 months of age. n = 4–5/group. c ipRGCs were stained with Opsin 4 antibody (purple) and the number of ipRGC at the peripheral retina was quantified. Arrowheads indicate the soma of ipRGCs. Schema depicts retinal area selected to take images. P peripheral area, M middle area; C central area. n = 4–10/group; eight images were taken at the peripheral retina for each sample and calculated as average value. Scale bar: 50 µm. *p < 0.05; **p < 0.01; ***p < 0.001; ****p < 0.0001 versus WT

