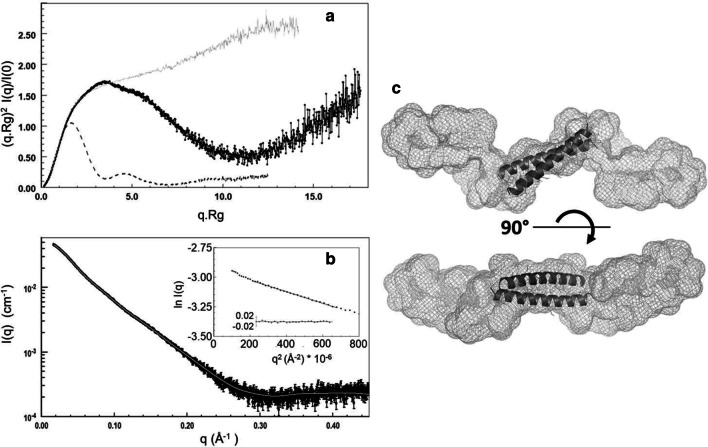
Fig. 6.
SAXS characterisation of CP12: an extended dimer. a Normalized and dimensionless Kratky plot. The data for T. pseudonana CP12 is shown in black, and can be compared with that for a fully disordered protein (C. reinhardtii reduced CP12 [10]), in grey, and that for a globular protein (C. reinhardtii GAPDH [11]) with dotted line. b Scattering intensity for CP12 (black) as a function of q (4π/λsinθ) overlaid with the DAMMIF fit (grey) related to the shape shown in c. The coiled coil structure calculated by Swiss-Model is inserted in the SAXS envelope (c). The insert in b shows the Guinier plot together with the residuals

