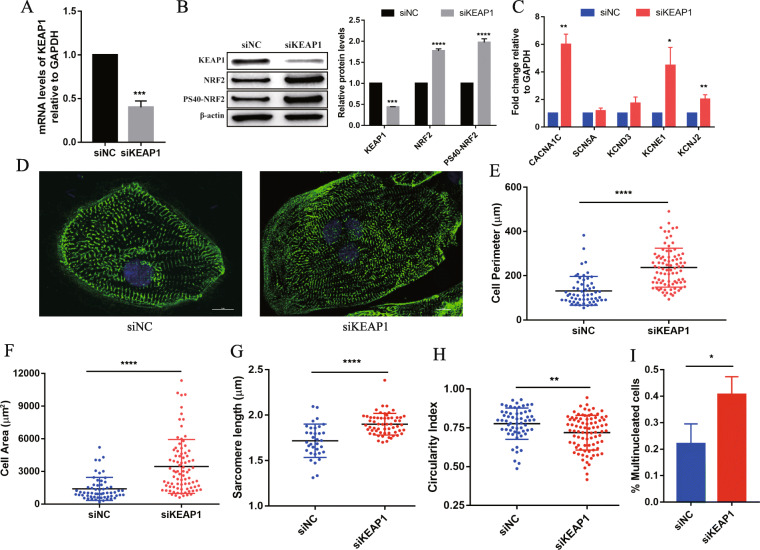
Fig. 4.
NRF2 promotes the morphology and structural maturation of hiPSC-CMs. a Q-PCR to detect the expression of KEAP1 in siKEAP1 and siNC hiPSC-CMs. b Western blot (left) and quantification (right) to detect the expression of KEAP1, NRF2, and phosphorylated NRF2 (PS40-NRF2) in siKEAP1 and siNC hiPSC-CMs. n = 3. c mRNA expression of ion channels in siKEAP1 and siNC hiPSC-CMs. Gene expression is normalized first to GAPDH and then normalized to siNC. d α-Actinin (green) and Hoechst (blue) staining of representative siKEAP1 and siNC hiPSC-CMs (scale bar = 10 μm). e–i Compared with siNC cells, siKEAP1 cells showed a significant increase in e perimeter, f area, g sarcomere length, and i multinucleation ratio (n = 3) and h a decrease in the circularity index (n > 10 cells per condition, three biological replicates). The means ± SEM are shown. *P < 0.05, **P < 0.01, ***P < 0.001, ****P < 0.0001

