Fig. 6.
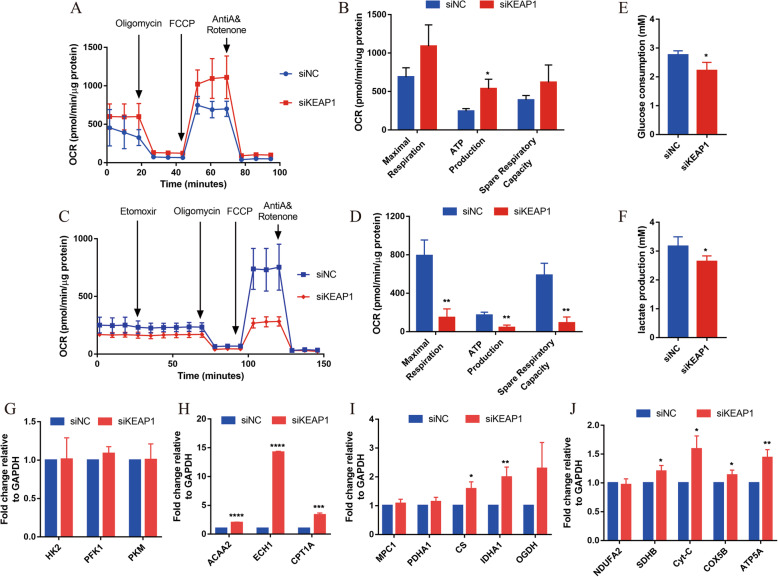
NRF2 promotes hiPSC-CM mitochondrial metabolism maturation. a Representative mitochondrial respiration in siKEAP1 and siNC hiPSC-CMs after incubation with oligomycin, FCCP, rotenone, and antimycin A. b Quantification of the maximal respiration capacity, ATP production, and spare respiratory capacity in the siKEAP1 and siNC hiPSC-CMs (n = 4 for each group). The means ± SEM are shown. *P < 0.05. c Representative fatty acid oxidation in siKEAP1 and siNC hiPSC-CMs after incubation with the Etomoxir, oligomycin, FCCP, and rotenone and antimycin A. d Quantification of maximal respiration capacity, proton leakage, ATP production, and spare respiratory capacity in siKEAP1 and siNC hiPSC-CMs (n = 4 for each group). The means ± SEM are shown. **p < 0.01. Glucose consumption (e) and lactic acid generation (f) of siNRF2 and siNC hiPSC-CMs were detected by kit. n = 3. Relative expression levels of the key metabolic genes in glycolysis (g), fatty acid β-oxidation (h), aerobic oxidation (i), and electron transport chain complex (j); n = 3; the means ± SEM are shown. *P < 0.05, **P < 0.01, ***P < 0.001, ****P < 0.0001

