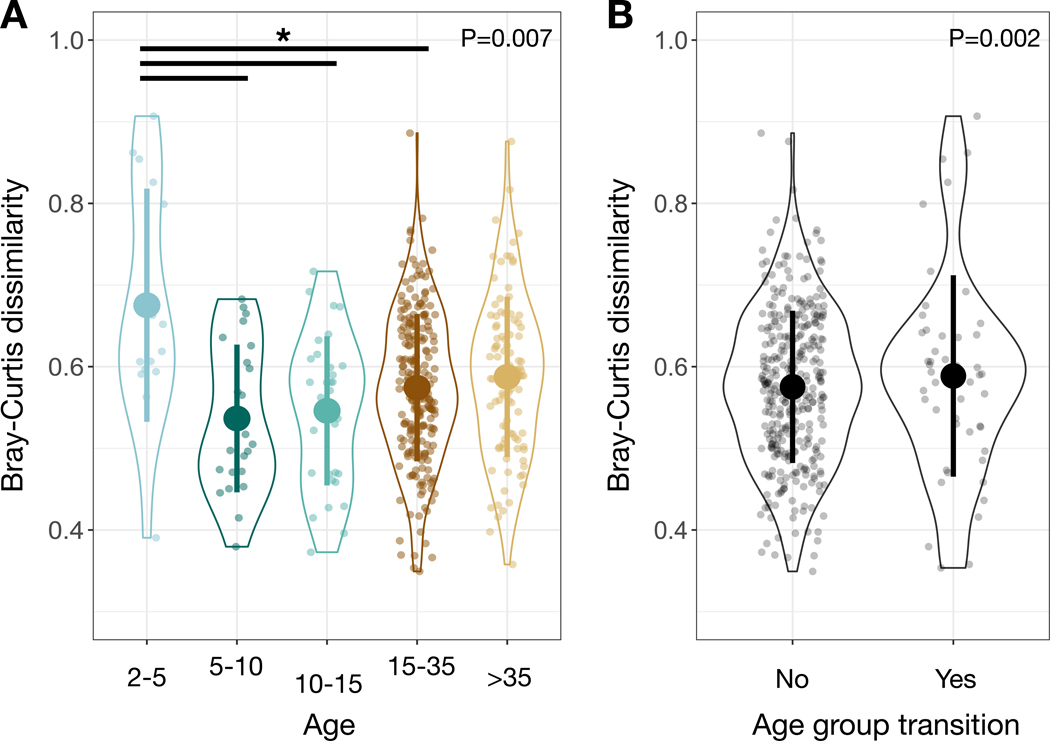
Figure 3: Change over time in an individual’s gut microbial community composition depends on age and transition between age groups.
(A) Bray-Curtis dissimilarities for an individual chimpanzee compared to itself over time (with greater than one year between samples) as a factor of age group. (B) Bray-Curtis dissimilarities for an individual chimpanzee compared to itself over time (with greater than one year between samples) as a factor of whether the elapsed time led to them transitioning between two age groups. Large circles are means; bars show standard deviations. P values reported for linear mixed effects model likelihood tests. * indicates P<0.05 contrast for estimated marginal means of linear mixed effects model. See also Data S1 and Table S2.

