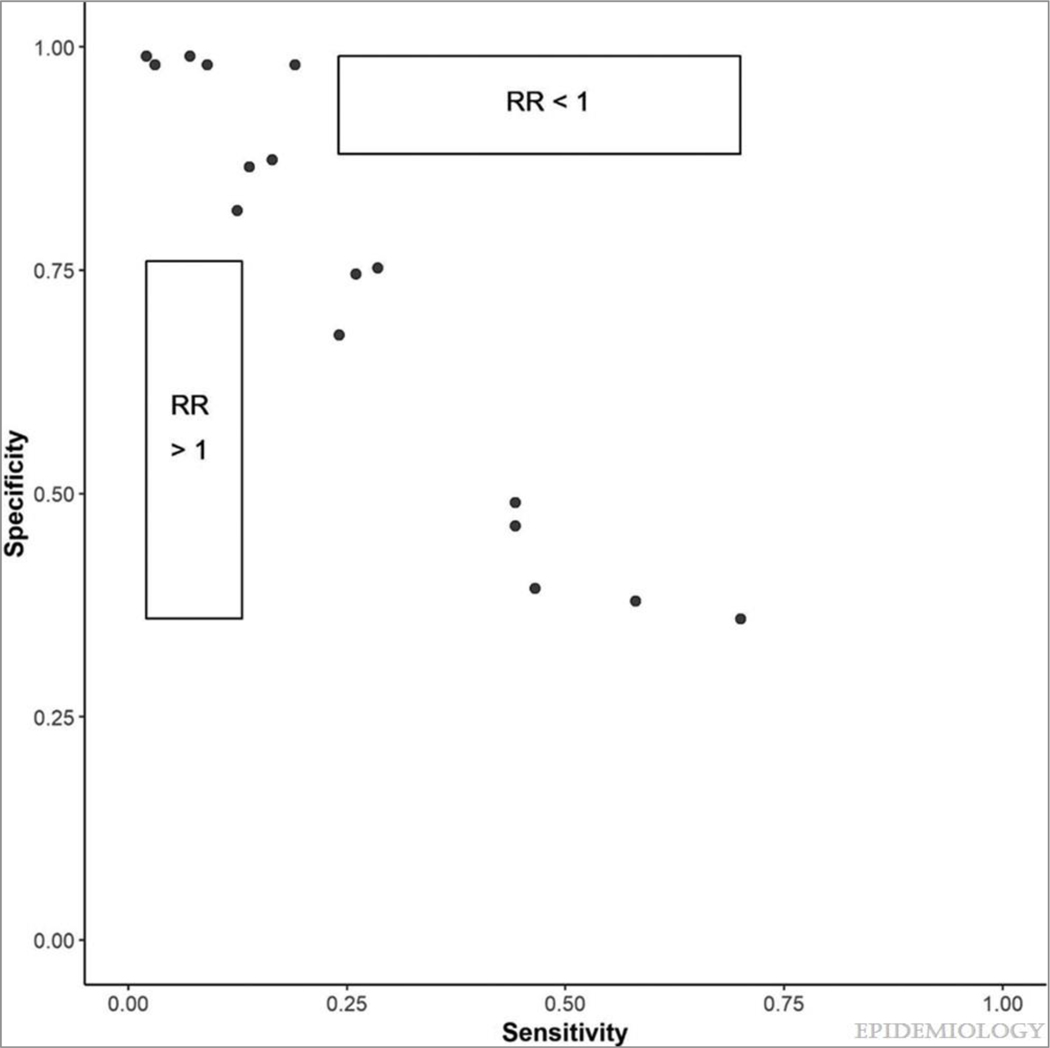
Figure.
An exploratory bias analysis of published sensitivities and specificities for ICD-9 codes for OSA compared to polysomnography.
Points represent published sensitivities and specificities from validation articles, all of which resulted in adjusted expected frequencies that had negative values in the bias analysis. Rate ratio (RR): OSA misclassification adjusted rate ratios for the association between OSA and ischemic stroke. RR >1 represents the combination of sensitivities and specificities that could result in OSA misclassification adjusted rate ratios greater than 1 in this dataset. RR <1 represents the combination of sensitivities and specificities that could result in OSA misclassification adjusted rate ratios less than 1 in this dataset.

