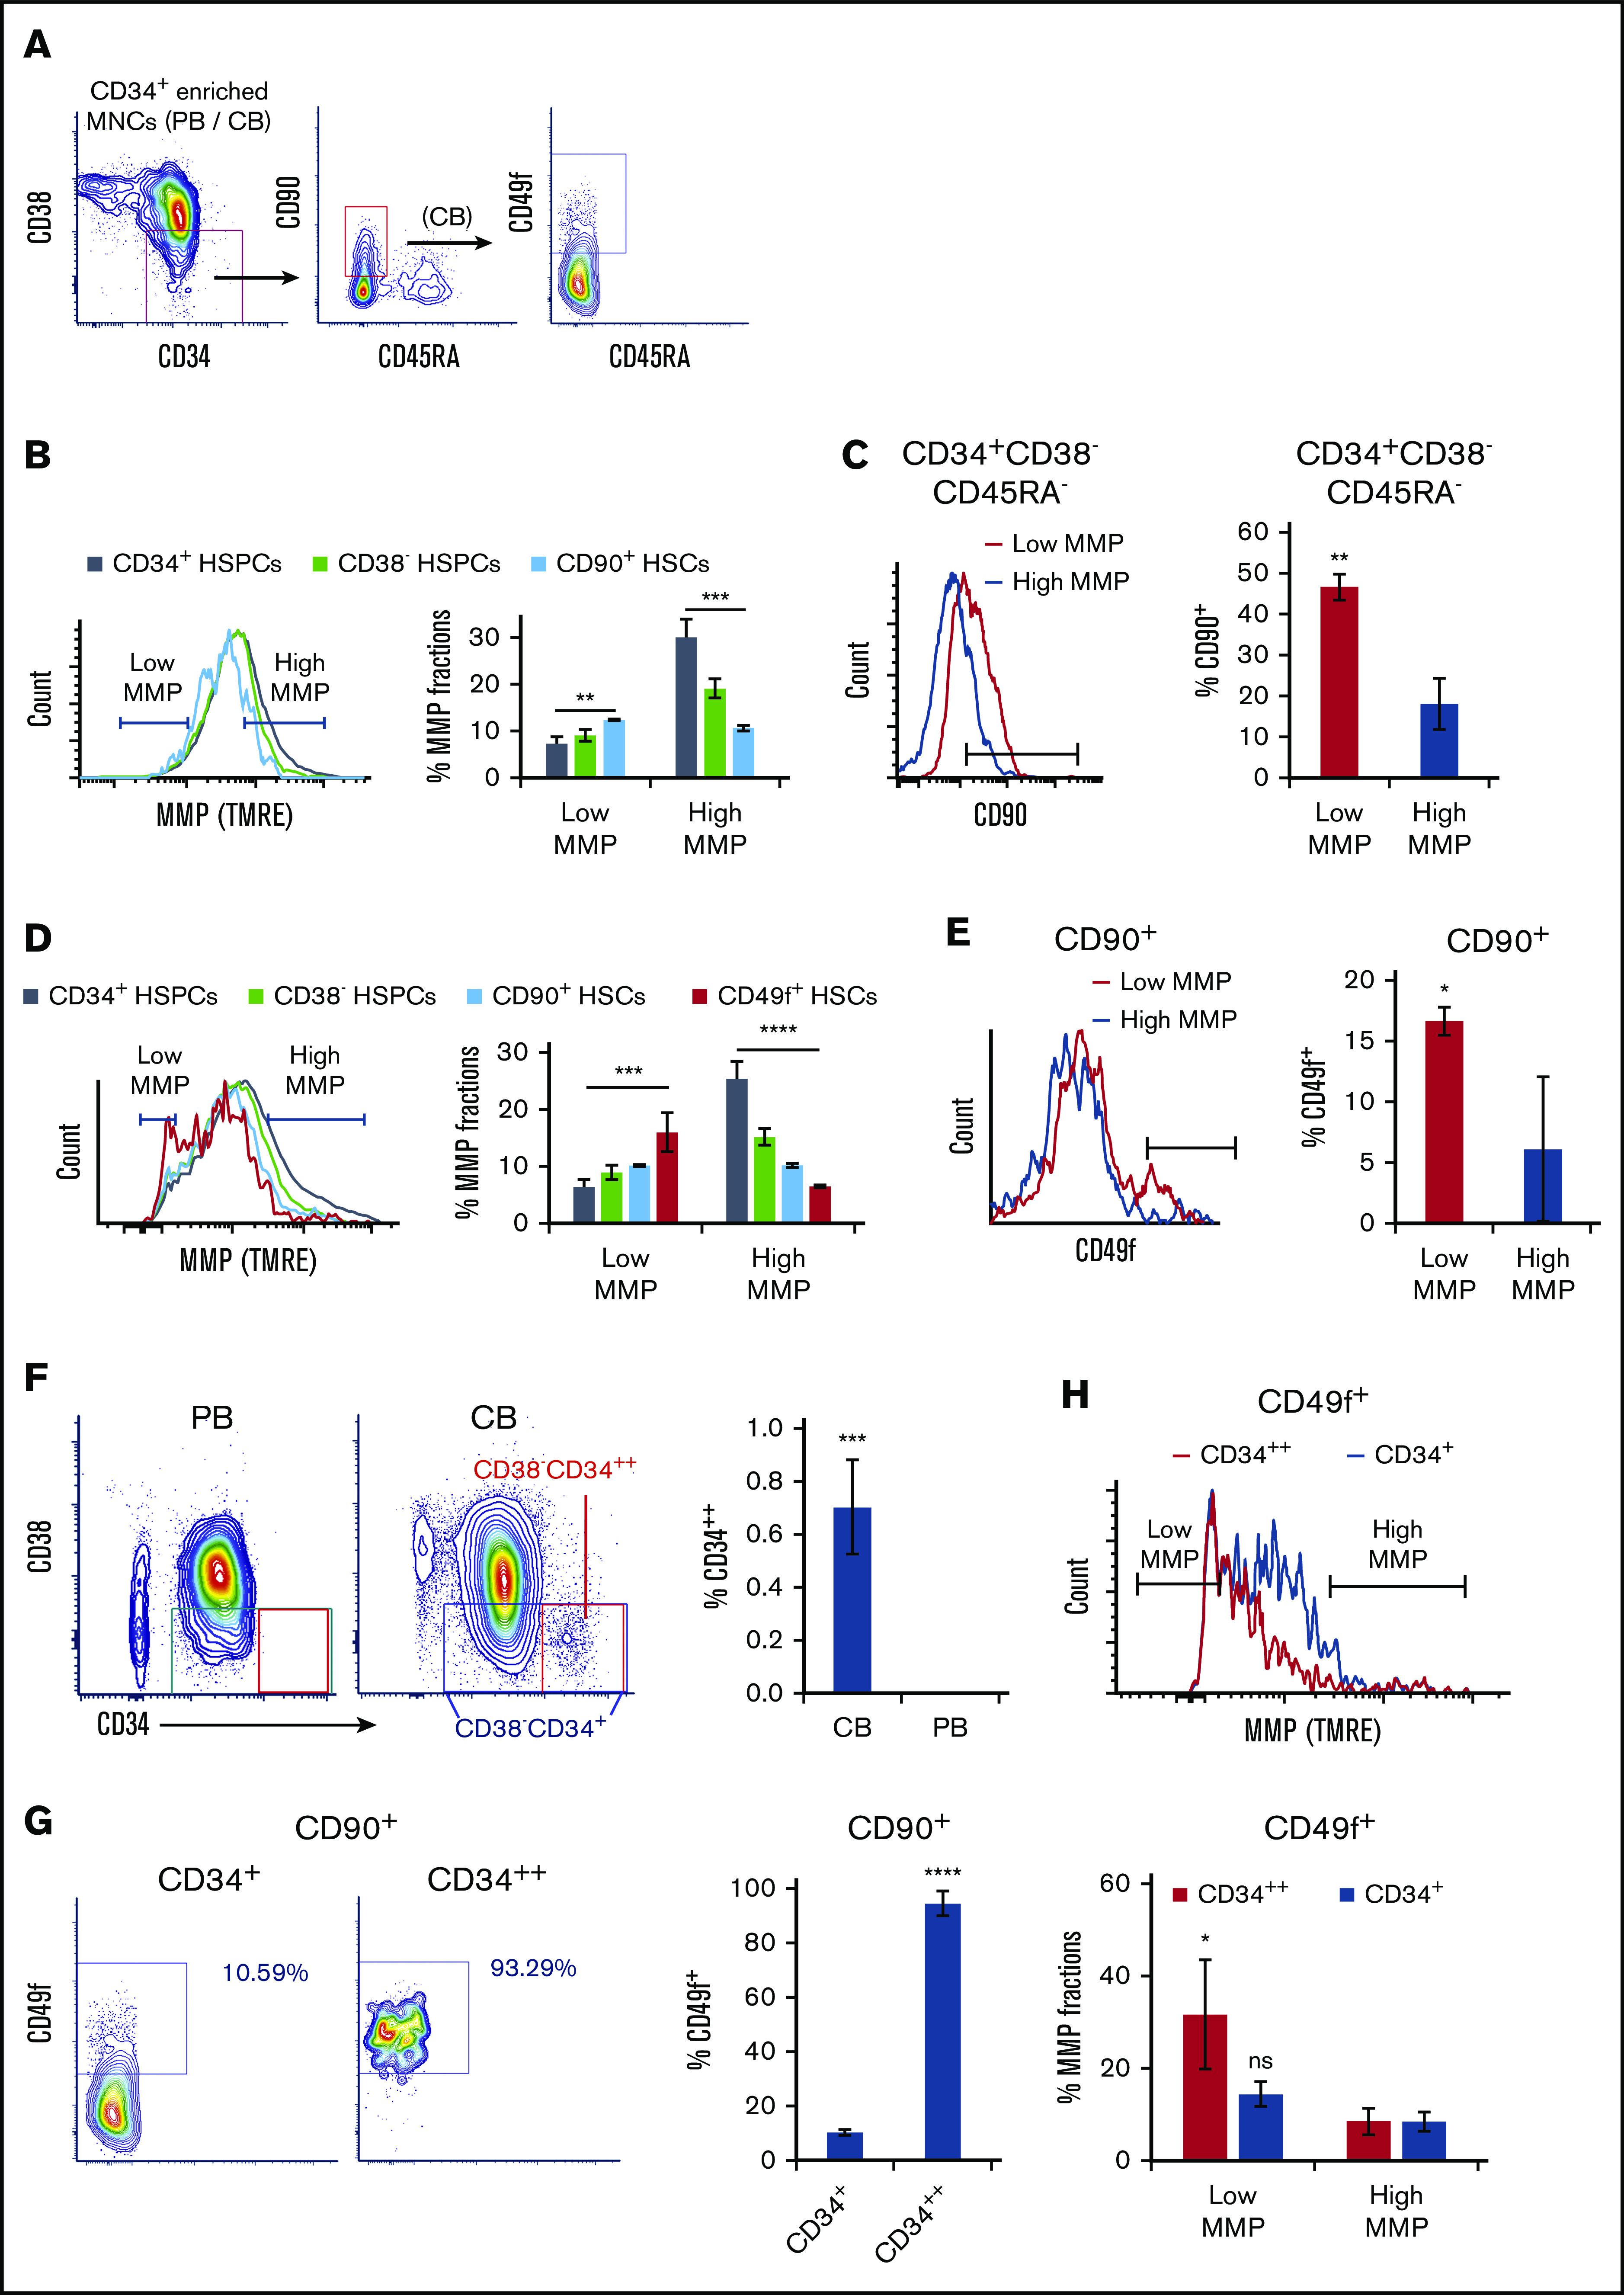
Figure 1.

Mitochondrial activity decreases in HSPC subpopulations with increasing stem cell activity. (A) FACS gating strategy of phenotypically defined HSCs/HSPCs. (B,D) FACS histograms (left) of MMP of CD34+ HSPCs, CD38− HSPCs (CD34+CD38−), CD90+ HSCs (CD34+CD38−CD45RA−CD90+), of (B) PB or (D) CB, and CD49f+ HSCs (CD34+CD38−CD45RA−CD90+CD49f+) of (D) CB. The percentage of low and high MMP fractions within parental compartments (right; panel B, n = 3; panel D, n = 5). (C,E) FACS histograms (left) of (C) CD90 or (E) CD49f of subsets at low- or high-MMP levels of (C) PB CD34+CD38−CD45RA− HSPCs or (E) CB CD90+ HSCs. The percentage of (C) CD90+ HSCs or (E) CD49f+ HSCs in parental populations (right; n = 3). (F) FACS profiles of CD34/CD38 of CD34+ cell–enriched PB or CB MNCs (left). The percentage of CD34++ cells in total CD34+ enriched MNCs of CB or PB (right; n = 4). (G) FACS profiles of CD49f of total CD34+ or CD34++ fraction of CD90+ CB HSCs (left); the percentage of CD49f+ HSCs in parental populations (right; n = 3). (H) FACS histogram of MMP of total CD34+ or CD34++ fraction of CD49f+ HSCs (top); the percentage of low- or high-MMP subset within total CD34+ or CD34++ fraction of CD49f+ CB HSCs (bottom; n = 3). Low-MMP and high-MMP gates were set according to 10% the lowest and highest MMP of CD90+ HSCs and applied to all other parental compartments throughout Figure 1. Phenotypes above the graphs indicate parental population. Data are presented as mean ± standard deviation; (C,E-H) Student t test; (B,D) analysis of variance test; *P < .05, **P < .01, ***P < .001, ****P < .0001. ns, not significant.
