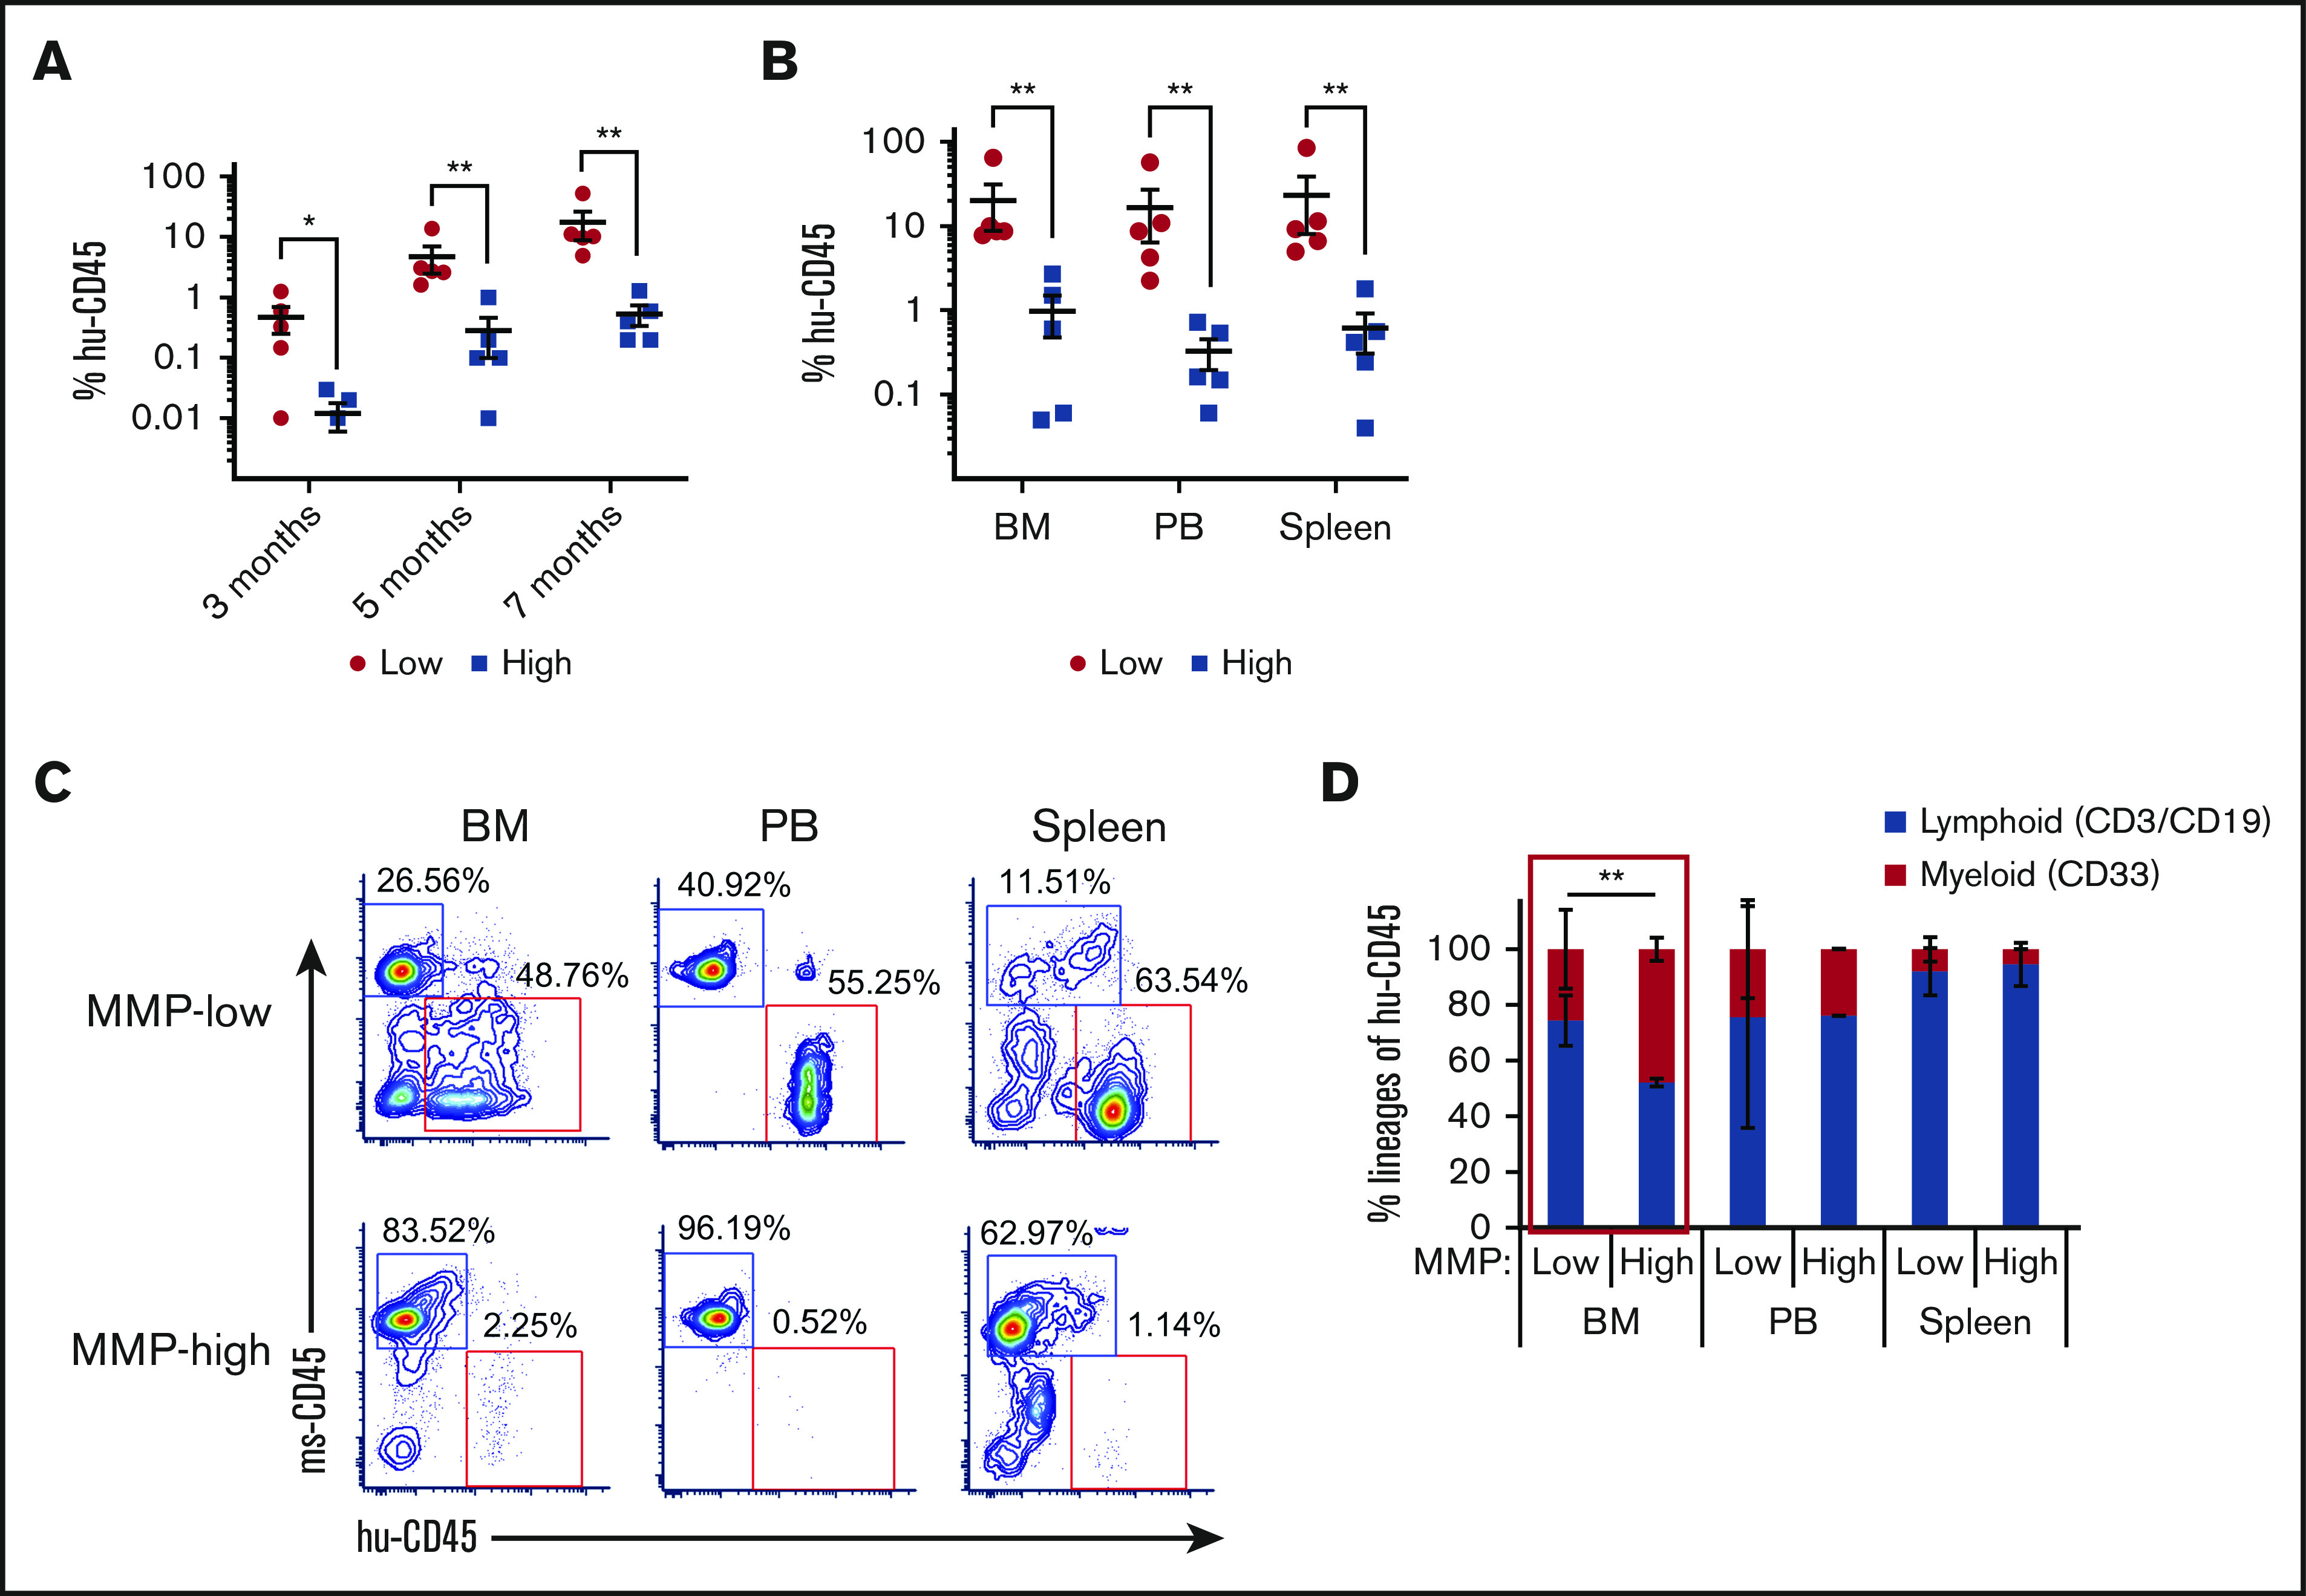
Figure 3.

HSCs of lower mitochondrial activity show greater long-term repopulating capacity. (A) Temporal analysis of the engraftment ratio (the percentage of human CD45+ cells in total PB MNCs) of NSG mouse recipients of MMP-low or MMP-high CB CD90+ HSCs at 3, 5, and 7 months posttransplantation. (B) The engraftment ratio (the percentage of human CD45+ cells in total human and mouse CD45+ MNCs) in BM, PB, and spleen 7 months posttransplantation. (C) Representative FACS profiles of BM, PB, and spleen plotted as human CD45 (hu-CD45) (X) vs mouse CD45 (ms-CD45) (Y) from MMP-low or MMP-high recipient mice 7 months posttransplantation. (D) Myeloid/lymphoid lineage distribution (percentage of human CD33+ vs CD3+/CD19+ cells in total human CD45+ cells) in BM, PB, and spleen 7 months posttransplantation. Lineage analysis was performed only for transplants with engraftment ratio above 1%. Data are represented as mean ± standard deviation; (D) Student t test; (A-B) Mann-Whitney U test, *P < .05, **P < .01.
