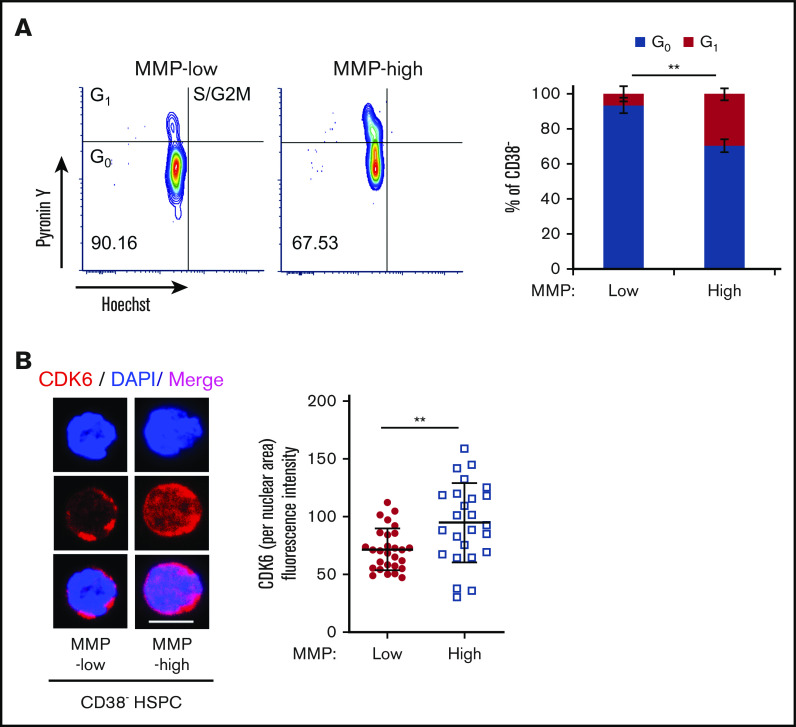
Figure 4.
Subpopulations of quiescent HSCs with distinct mitochondrial activity. (A) FACS profiles (left) of cell-cycle analysis of sorted CD38− PB HSPCs, by Pyronin Y/Hoechst staining; percentage of G0 and G1 phases in MMP-low or MMP-high subsets (right; n = 3). (B) Representative immunofluorescent confocal image (left) of CDK6 and quantification of fluorescence intensity of CDK6 within nuclear area (right) in MMP-low and MMP-high CD38− PB HSPCs. CDK6, red; DAPI, blue; scale bar, 5 μm. Data are represented as mean ± standard deviation; Student t test, **P < .01.

