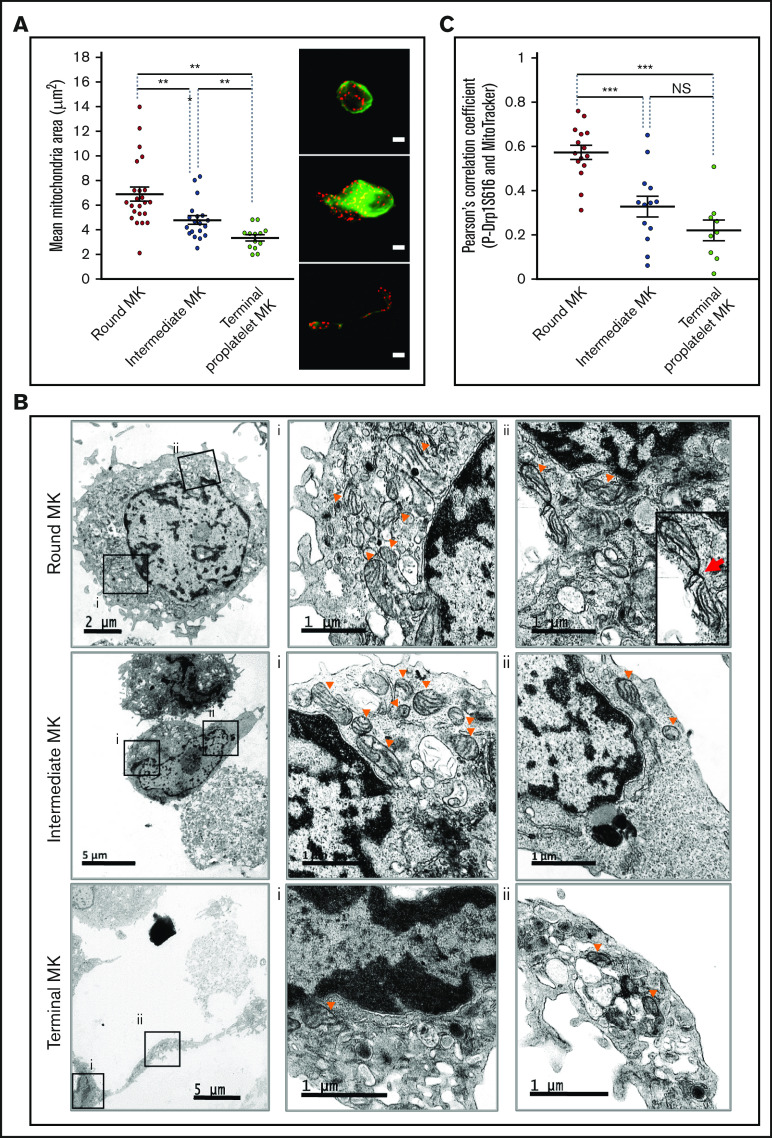
Figure 4.
Changes in mitochondrial dynamics during proplatelet formation. (A,C) Mature MKs were incubated for 5 hours before being processed for fluorescence microscopy after MitoTracker labeling. (A) Mean mitochondrial areas of individual round (red dot), intermediate (blue dot), and terminal (green dot) MKs. Dot plots show individual data and median lines (n = 3, Mann-Whitney U test); representative images of MitoTracker (red) and α-tubulin (green) labeling are shown on the right. Bars represent 10 µm. **P < .01. (B) Mature MKs were collected and processed for transmission electron microscopy; images illustrate round (top), intermediate (middle), and terminal (bottom) MKs. Boxes (Bi-ii) indicate areas enlarged for visualization of the mitochondria, at original magnification ×3000 for round/intermediate MKs and ×4000 for terminal MKs. Arrowheads indicate representative mitochondria; red arrow indicates a mitochondrial fission. (C) PhosphoSer616-Drp1 antibody (green) was used in colabeling with MitoTracker (red) and processed for fluorescence confocal microscopy. Pearson’s correlation coefficients were measured for the 2 fluorescent signals (MitoTracker, P-Ser616Drp1) by using the JACoP plugin of ImageJ for the indicated MKs (dots). Dot plots show individual data and median lines (n = 3; ***P < .001; Mann-Whitney U test).

