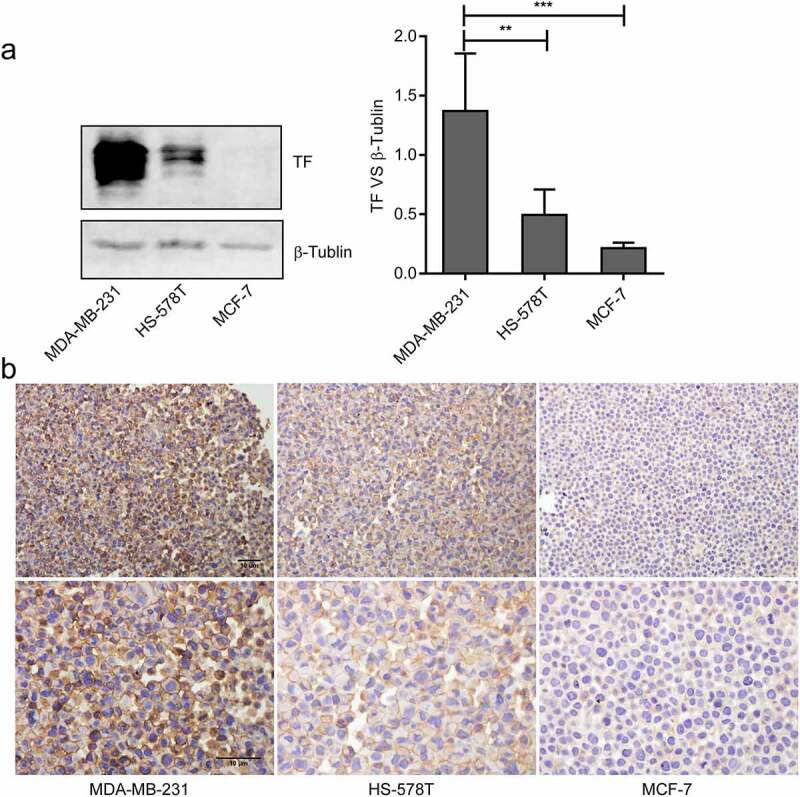
Figure 1.

The expression and location of TF in breast cancer cells.(a)The levels of TF in MDA-MB-231cells, HS-578 T cells and MCF-7 cells were monitoredusing Immunoblots(n = 3),the bar graphon the right represents densitometry measurements for multiple SDS-PAGE(**P < 0.01, ***P < 0.001 vs.MDA-MB-231 cells). (b) Cell immunohistochemistry was used to measure the expression of TF in MDA-MB-231 cells, HS-578 T cellsand MCF-7 cells, bar = 10 μm
