Figure 2.

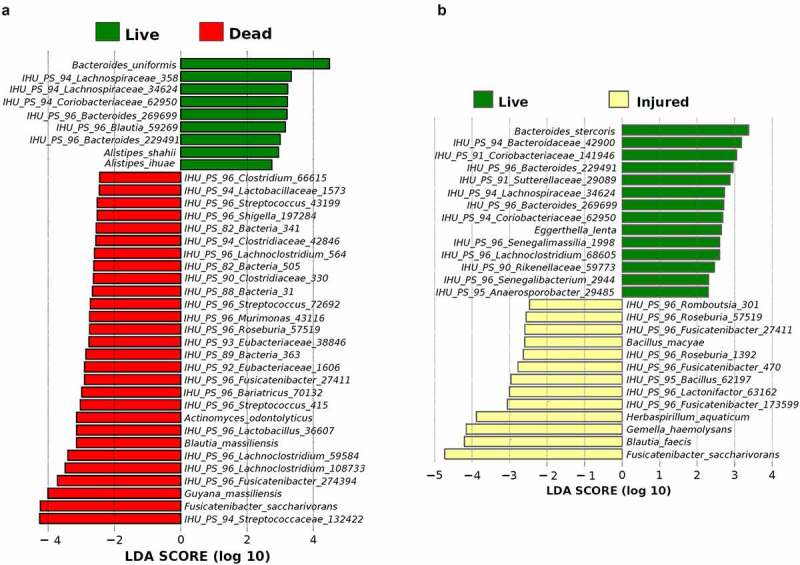
Histogram of the LDA scores computed for differentially abundant bacterial OTUs between live and dead bacterial groups (a) and live and injured bacterial groups (b)

Histogram of the LDA scores computed for differentially abundant bacterial OTUs between live and dead bacterial groups (a) and live and injured bacterial groups (b)