Figure 1.

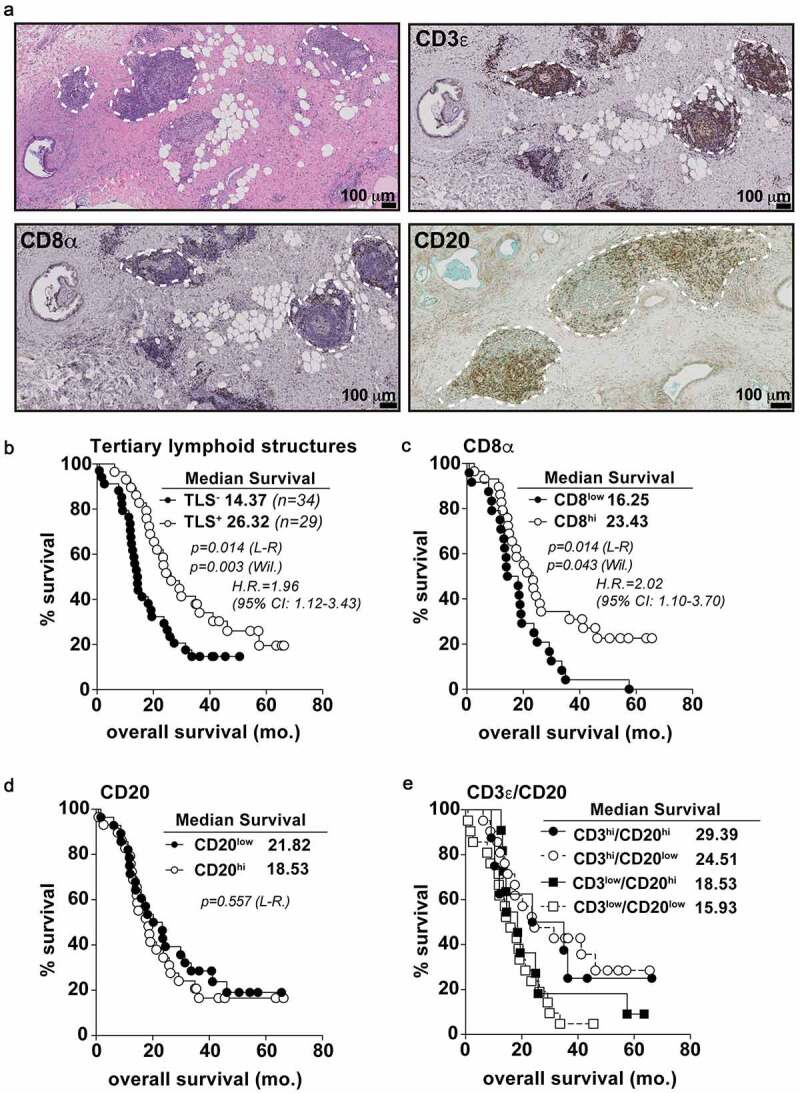
T and B cell aggregates in untreated PDAC tumors predict overall survival. A) Histological micrographs (10x) representative of TLS+ PDAC patients from the PCI cohort. From top left to bottom right: H&E, CD3 IHC, CD8 IHC, and CD20 IHC. TLS regions are outlined in dashed white lines. B) Kaplan-Meier plots displaying overall survival stratified for TLS positivity. Every data point is shown regardless of censor. C-E) CD8 univariate (c), CD20 univariate (d) and CD20/CD3 multivariate (e) analysis for overall survival. Log-rank comparison between CD3hi/CD20hi and CD3hi/CD20low groups non-significant at p = .701. Median cut points were determined for hi vs. low infiltration for all IHC markers. L-R = Log-rank; Wil. = Wilcoxon; H.R. = Hazard ratio; CI: confidence interval. Statistical comparisons were made between all groups. If no p-value is displayed, the comparison was not statistically significant
