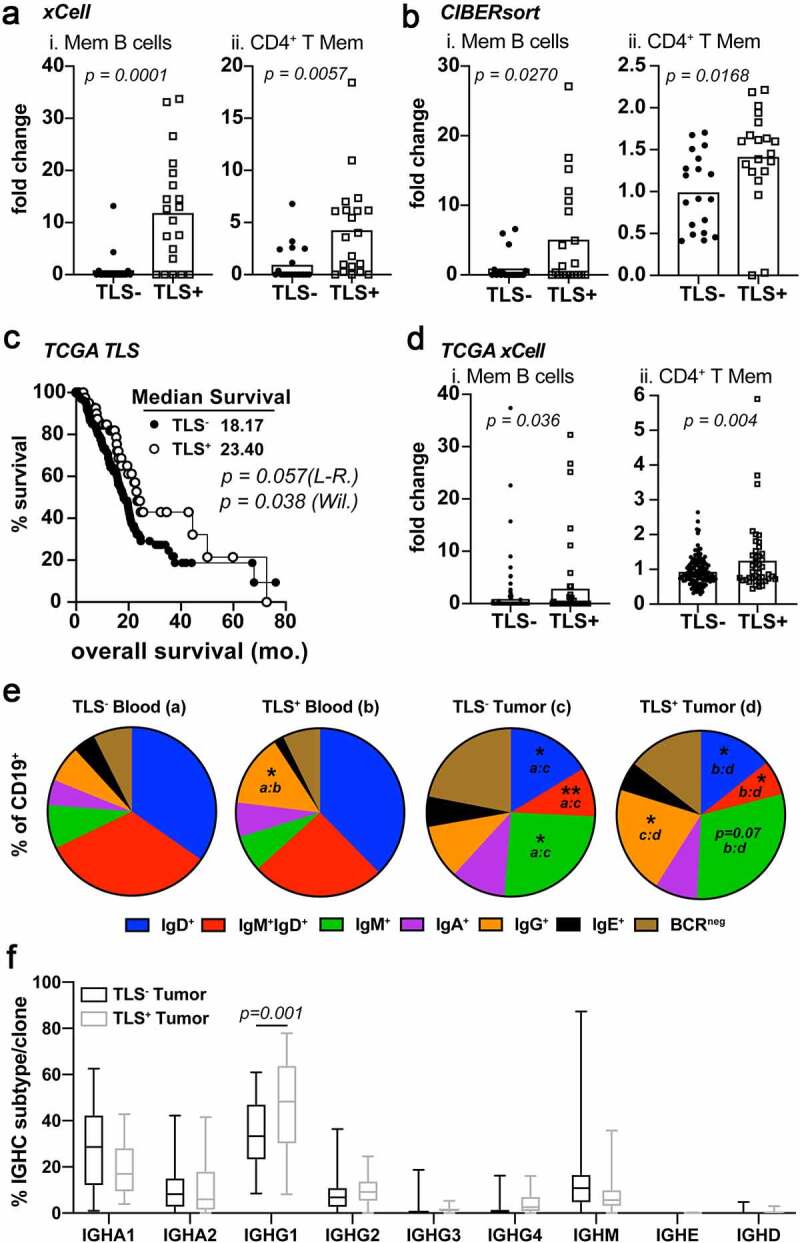
Figure 3.

IgG1 class-switched memory B and CD4+ T cells subsets are enriched in TLS+ tumors. A) xCell enrichment scores for Memory B cells (i), CD4+ T memory cells. Deconvolution analysis was generated using TPM normalized RNA-seq data from whole tumor tissue sections. B) CIBERsort enrichment scores for Memory B cells (i), CD4+ T memory cells C) Kaplan-Meier analysis for overall survival and progression free survival stratifying TCGA-PDAC patients (n = 174) based on TLS positivity (TLS+ n = 44). Log-rank and Wilcoxon statistical significance are displayed within the plots. D) xCell enrichment scores for Memory B cells (i) and CD4+ T memory cells (ii) from deconvoluted TCGA RNA-seq data. E) FACS analysis on peripheral blood (groups a and b) and tumors (groups c and d) of PDAC patient samples following surgery. Shown is the mean percentage Ig isotype+ cells of total CD19+ B cells. Statistical significance is indicated within each pie comparing each group as indicated. * p < .05, ** p < .01. F) IGHC analysis from RNA-seq data as determined by the TRUST algorithm. Data is shown as the percent IGHC clone/total clones counted and displayed as box and whisker plots of the mean average and total range of the data. Statistical comparisons were made between all groups. If no p-value is displayed, the comparison was not statistically significant
