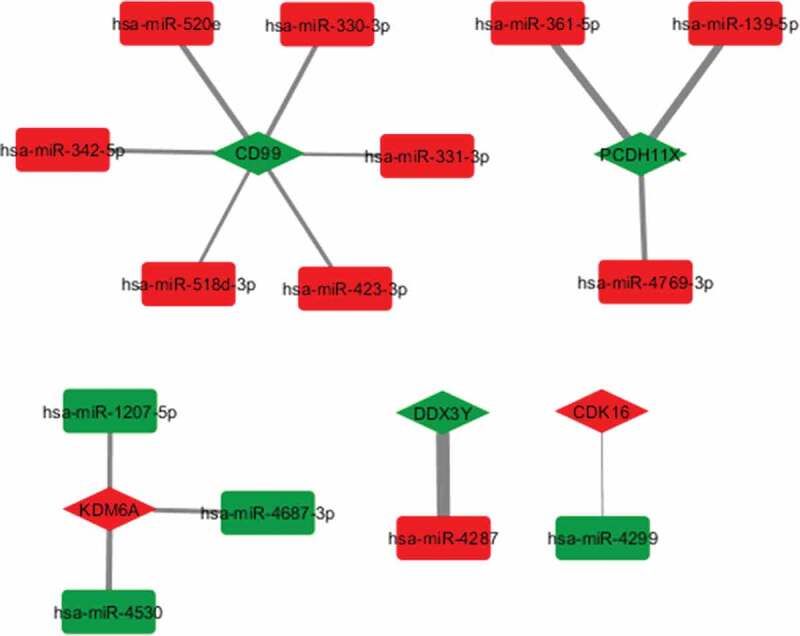
Figure 2.

The miRNA-mRNA sex interactome. Significantly (FDR<5%) identified miRNA-mRNA interactions (n = 14) obtained by miRComp, using Cytoscape v3.7.2. Rectangle nodes indicate miRNAs (as sources) and diamond nodes indicate mRNA (as targets). The red colour indicates upregulation, while the green downregulation in girls compared with boys. The width of the arrows connecting rectangle and diamond nodes corresponds to the calculated scores, with thicker arrows indicating higher absolute log ratio scores
