
Figure 4.
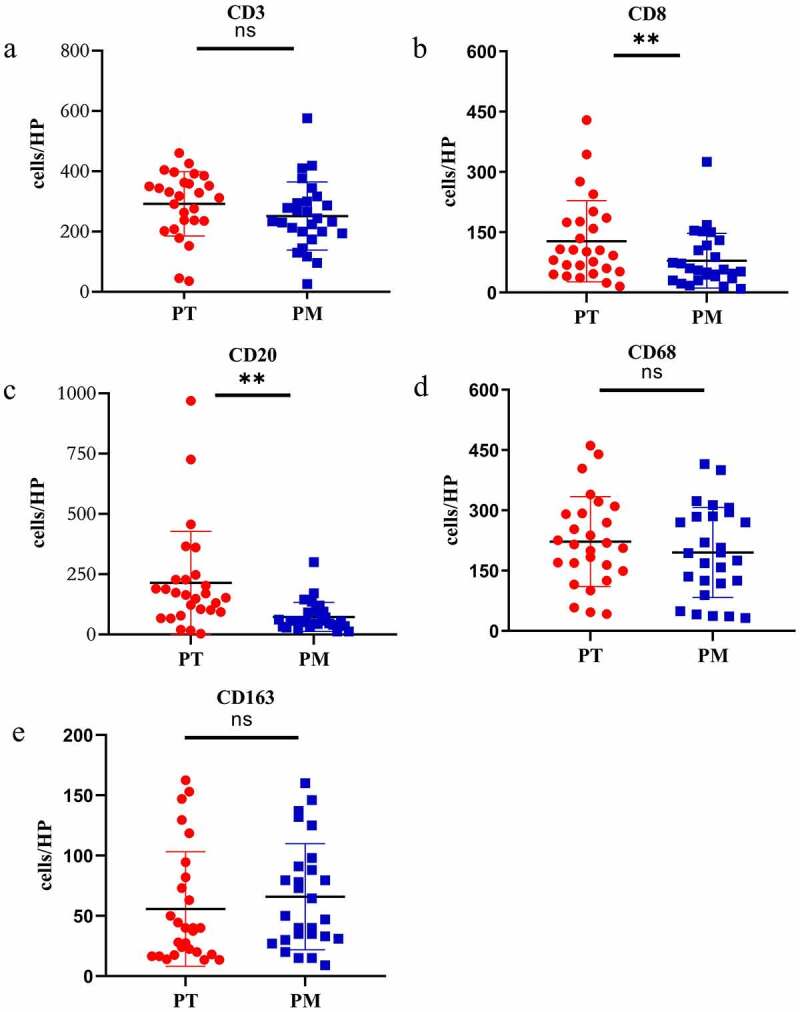
The density was calculated as the number of positive cells/HP (Y-axis), X-axis represents the lesions in different parts. A two-sided paired t test was applied to compare the infiltrating density of each subtype immunocyte in PM with the corresponding primary lesions. a: CD3 + T cell, b: CD8 + T cell, c: CD20 + B cell, d: CD68+ macrophage, e: CD163+ macrophage. PT: primary tumor (red), PM: peritoneal metastasis (blue), HP: high power field of view, (*represents P < .05, ** represents P < .005, ns: no statistical difference)