
Figure 2.
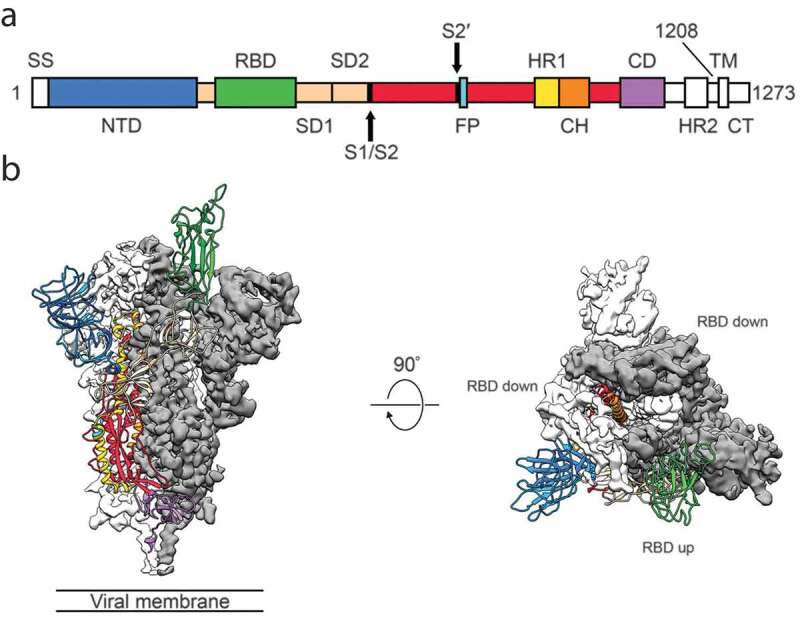
Structure of 2019-nCoV S in the prefusion conformation.20 (a) Schematic of 2019-nCoV S primary structure colored by domain. Domains that were excluded from the ectodomain expression construct or could not be visualized in the final map are colored white. SS, signal sequence; S2′, S2′ protease cleavage site; FP, fusion peptide; HR1, heptad repeat 1; CH, central helix; CD, connector domain; HR2, heptad repeat 2; TM, transmembrane domain; CT, cytoplasmic tail. Arrows denote protease cleavage sites. (b) Side and top views of the prefusion structure of the 2019-nCoV S protein with a single RBD in the up conformation. The two RBD down protomers are shown as cryo-EM density in either white or gray and the RBD up protomer is shown in ribbons colored corresponding to the schematic in (a). Reprint from reference.20