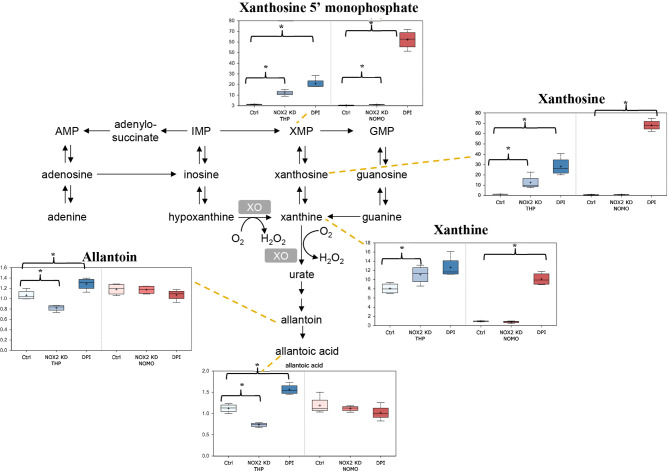
Figure 2.
Alterations in purine metabolism in NOX2 KD and DPI-Treated AML cell lines. Data from global biochemical profiling of shTHP-1 and shNOMO-1 cells with NOX2 KD or treated with DPI (100 nM) for 24 h followed by analysis by Metabolon™. Levels of biochemicals normalized to total protein in purine metabolism. Statistical significance analyzed by Welch’s two sample t-Test (n = 4 per group) and significance denoted by *, P < 0.05. Ctrl, untreated control cells; XMP, xanthosine 5′-monophosphate; GMP, guanosin-monophosphate; XO, xanthine oxidase. THP-1 cells are color coded (blue) and NOMO-1 cells color coded Red. Y axis is scaled intensity.

