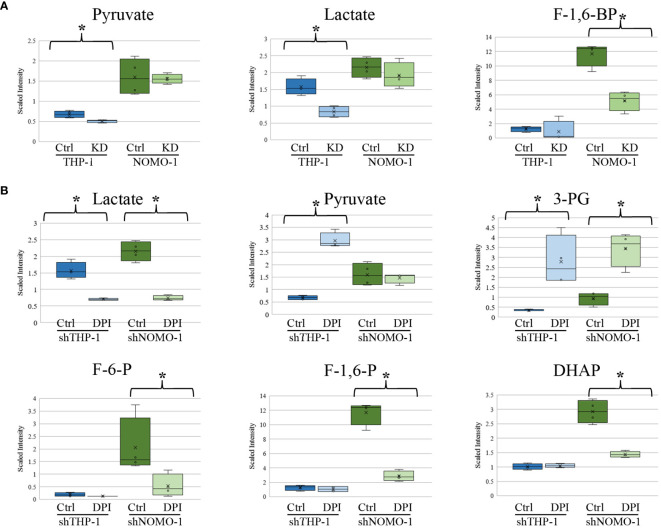
Figure 3.
Changes in glycolytic intermediates in AML derived cell lines with NOX2 KD or treated with DPI. Significant changes in glycolytic metabolites in (A) shTHP-1 and shNOMO-1 cells with NOX2 KD. (B) shTHP-1 and shNOMO-1 cells treated with DPI (100nM) for 24h. Data shows relative values following normalization to protein concentration, log transformation and imputation of missing values with the minimum observed value for each compound (n = 4). Box plots represent median quartile ranges, x represents mean value. * denotes p < 0.05 = as analyzed by Welch’s two sample t-test. THP-1 cells are color coded (blue) and NOMO-1 cells color coded green.

