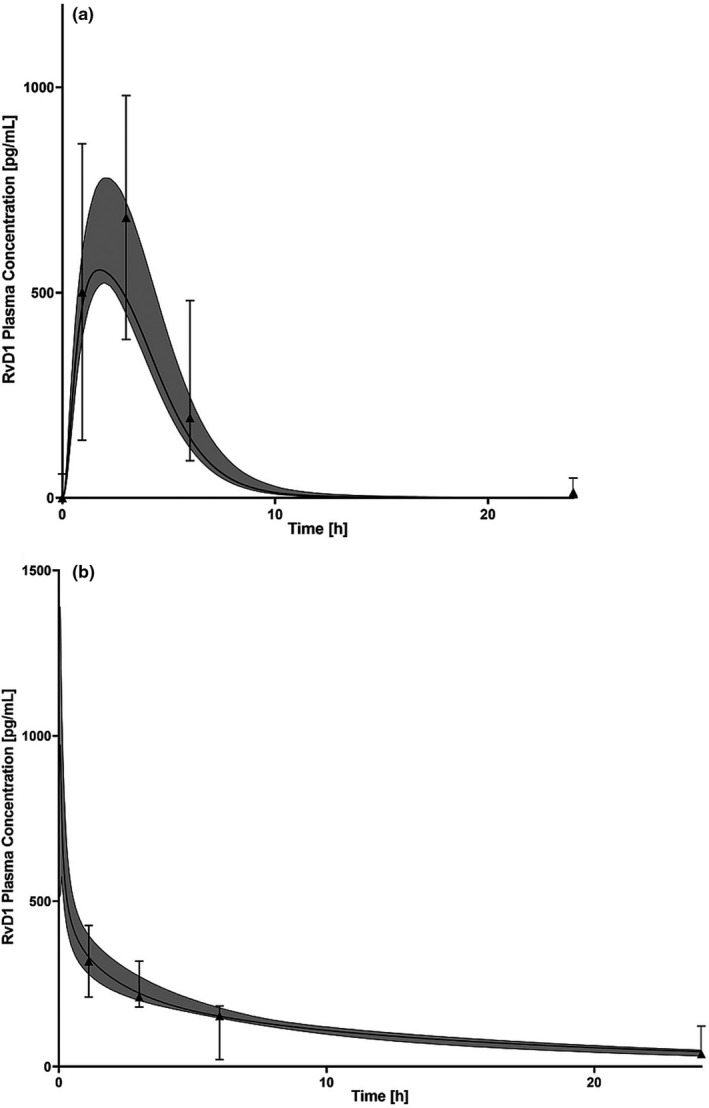
Figure 3.

The physiologically‐based pharmacokinetic concentration‐time model predictions of resolvin D1 (RvD1). Modelling was performed (a) following administration of an oral dose of 0.005 mg per kg in C57BL/6N mice and (b) intraperitoneal dose 0.2 µg/kg in Sprague‐Dawley rats . Solid black lines represent the median predicted concentration; and black triangle symbols represent data from each individual animal of the observed data obtained from the animal study reported by Recchiuti et al. 26 (a) and Krashia et al. 27 (b). The shaded region represents the 90% prediction interval for the simulated RvD1 concentrations.
