
Figure 1.
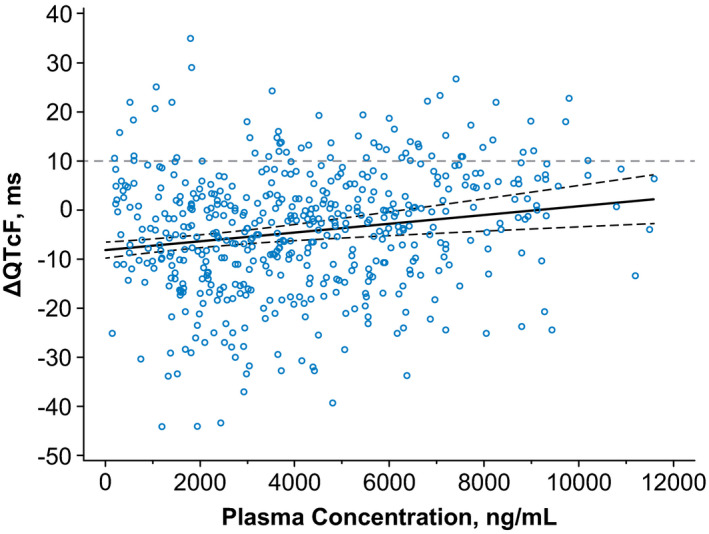
Change in QTcF vs. rovalpituzumab tesirine (Rova‐T) plasma concentration. The relationship between the change in QTcF and Rova‐T plasma concentrations was evaluated using a linear‐effects model with a fixed effect for intercept and random concentration (slope) per patient. The dotted lines represent the 90% confidence interval (CI). The regression line had an intercept of −8.1430, with a slope of 0.00089 (90% CI 0.00139–0.00139). ΔQTcF, change in Fridericia‐corrected QT interval.