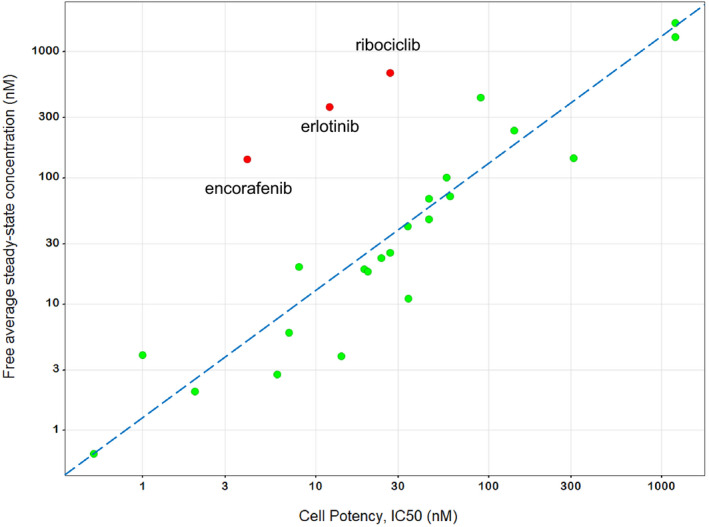
Figure 2.

Correlation between free average drug concentration at steady‐state (Css) and in vitro cell potency (half‐maximal inhibitory concentration (IC50)) for 25 targeted therapies. The dashed line is the line of unity. Notable outliers namely, encorafenib, erlotinib and ribociclib, are identified in red. Data are displayed on a log‐log scale to improve readability.
