
Figure 3.
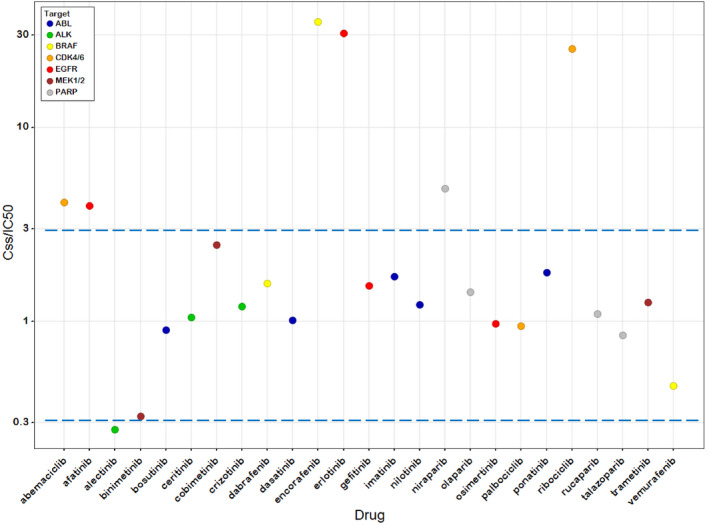
Steady‐state concentration (Css)/half‐maximal inhibitory concentration (IC50) values for 25 targeted therapies. Colors represent drug target. Dashed lines are drawn at ratios of 0.3 and 3 to depict a 3‐fold range of plausible values about unity. Data are displayed on a log‐log scale to improve readability.