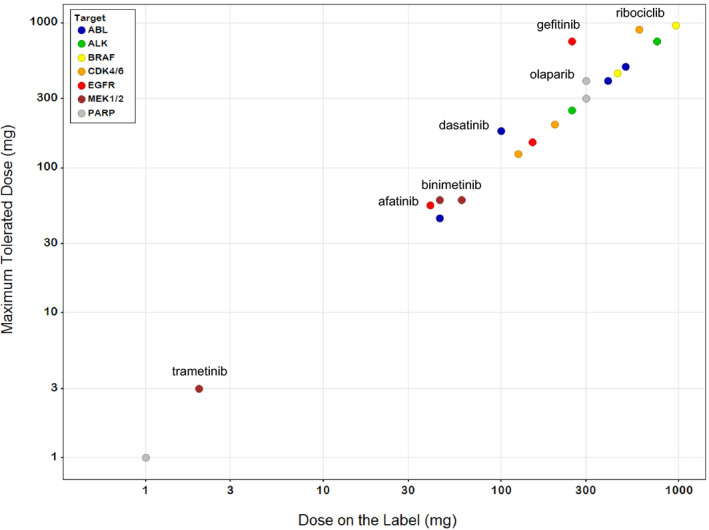
Figure 4.

Comparison of the maximum tolerated dose (MTD) to the dose on the label for 20 targeted therapies. All of the drugs are administered at a dose that is < 2 times the MTD; for 13 the recommended dose is the MTD. Drugs for which the MTD is higher than the dose on the label are identified. Drugs represented by the same colored circle inhibit common targets. Five drugs in the dataset are not included because the MTD was not formally identified. Doses are plotted on a log scale to improve readability.
