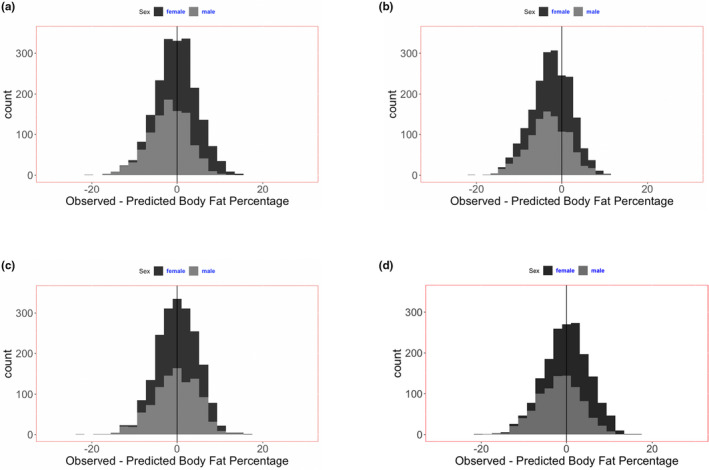
Figure 2.

Accuracy and precision of several methods of estimating body fat mass percentage in children. (a–c)The subject population was the NHANES survey of 2005–2006, in which fat percentage was measured by DEXA. (d) The subject population was the NHANES survey of 2003–2004, in which fat percentage was measured by both DEXA and bio‐impedance. Additional analyses of other anthropometric equations previously reported in the literature are provided in FigureS4. (a) New anthropometric equation to estimate body fat mass percentage: mean difference (SD) of DEXA observed and equation predicted values: −0.000300 (0.0487). (b) Anthropometric equations for estimation of BF% reported by Al‐Sallami (2015): mean difference (SD) of DEXA observed and equation predicted values: −0.0249 (0.0467). Less accurate (P < 0.001), but not different in precision (P > 0.05) than new predictive equations. (c) BF% estimation from the mean population values by obesity stage: mean difference (SD) of DEXA observed and mean value of the respective obesity stage: −0.00033 (0.0481). Not different in accuracy or precision (P > 0.05) than new predictive equations. (d) BF% measured by bio‐impedance: mean difference (SD) of DEXA observed and bio‐impedance predicted values: −.0016 (0.0524). Statistical comparison with new predictive equations not performed because these equations were generated using these data in the NHANES 2003–2004 survey. BF%, body fat percentage; DEXA, dual energy x‐ray absorptiometry; NHANES, National Health and Nutrition Examination Survey.
