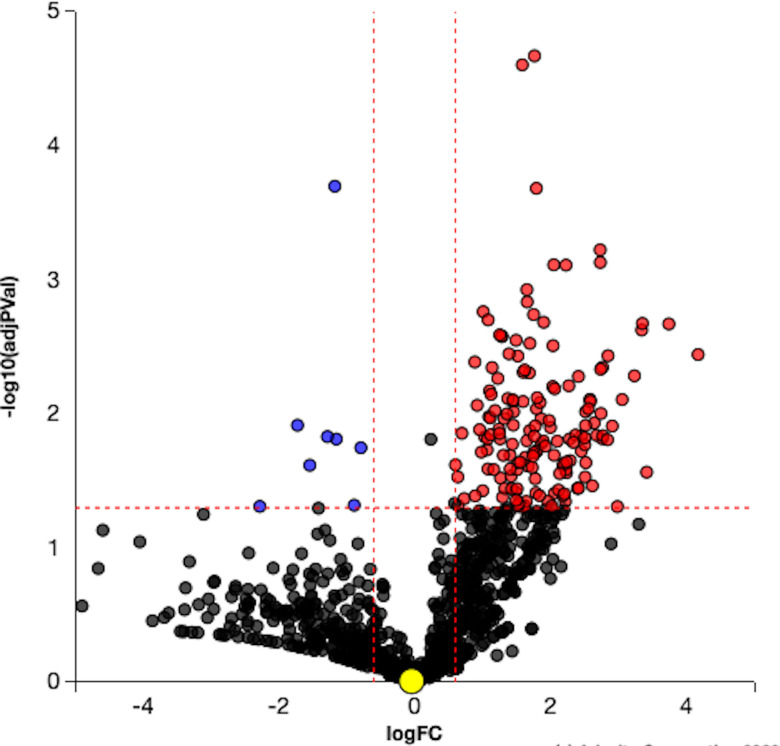
Figure 1.
Volcano plot. Differentially expressed (DE) proteins are represented in terms of their measured significance of the change (y-axis) and the expression change (x-axis). Dotted lines represent the thresholds used to select the DE genes: 0.6 for expression change and 0.05 for p value. The upregulated proteins (positive log fold change) are shown in red, whereas the downregulated genes are blue. Insignificant proteins are shown in black.

