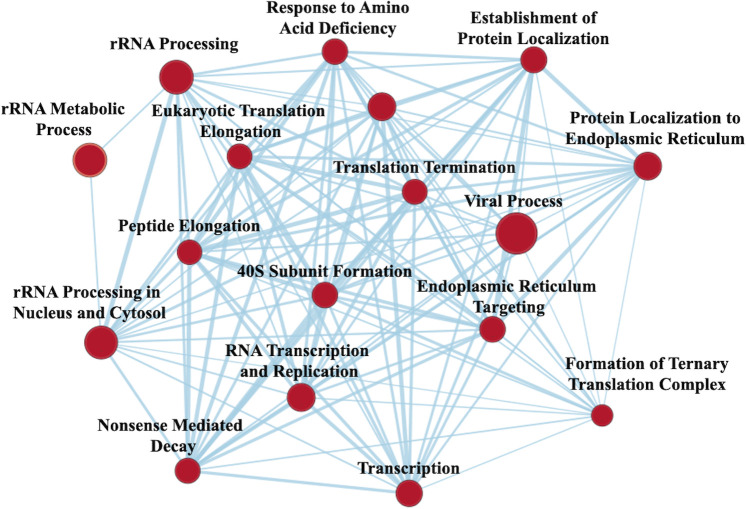
Figure 3.
Enrichment map from gene set enrichment analysis) illustrating networks of significantly enriched gene sets from proteomic analysis. Node size represents the number of genes in the gene set; edge thickness is proportional to the overlap between gene sets; red represents upregulation with valproic acid treatment.

