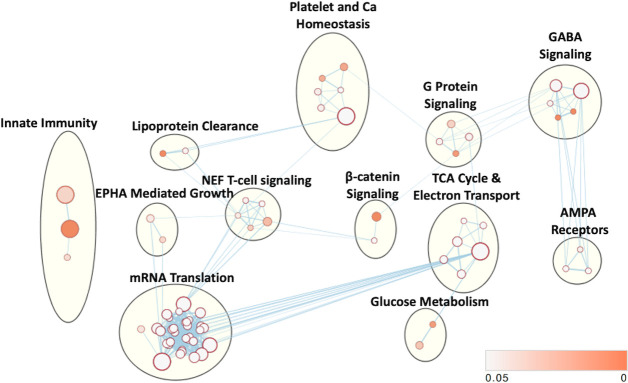
Figure 4.
Cellular networks affected by VPA treatment. Enriched gene sets based on differentially expressed proteins and subsequent enrichment analysis mapped into common clusters. Nodes represent pathways and edges represent overlapping genes. Increasing node size represents increased number of proteins contributing to that pathway. Increasing edge thickness represents increased overlap between pathways. Node darkness corresponds to decreasing p value according to legend in bottom right. VPA, valproic acid.

