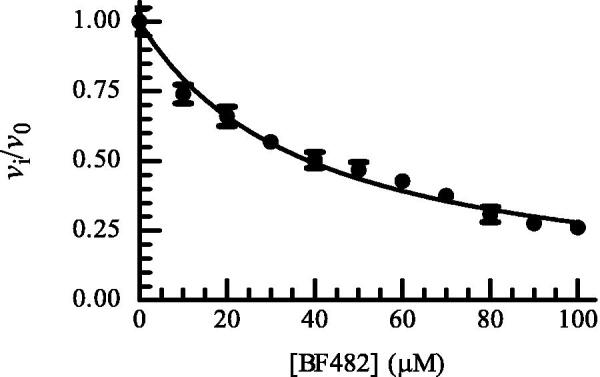
Figure 2.

Dose response plot of BF482 for MMP-9(A). The enzyme with and without inhibitor was pre-incubated for 30 min at room temperature and the reaction was started by adding McaPLGL(Dpa)AR-NH2 (4 μM in assay). The reaction was allowed to proceed for 4 h at 37 °C and stopped by the addition of EDTA (10 mM end concentration). The relative fluorescence was determined with the Clariostar plate reader as described in the Experimental Section, where vi and v0 are the reaction rates in the presence and absence of BF482, respectively. Each point on the curve shows the mean ± sd (N = 5 for all points except for two points where N = 4). The regression coefficient r2 is 0.97, with a determined IC50 value of 38.8 ± 0.9 μM and a Ki value of 19.4 ± 0.4 μM.
