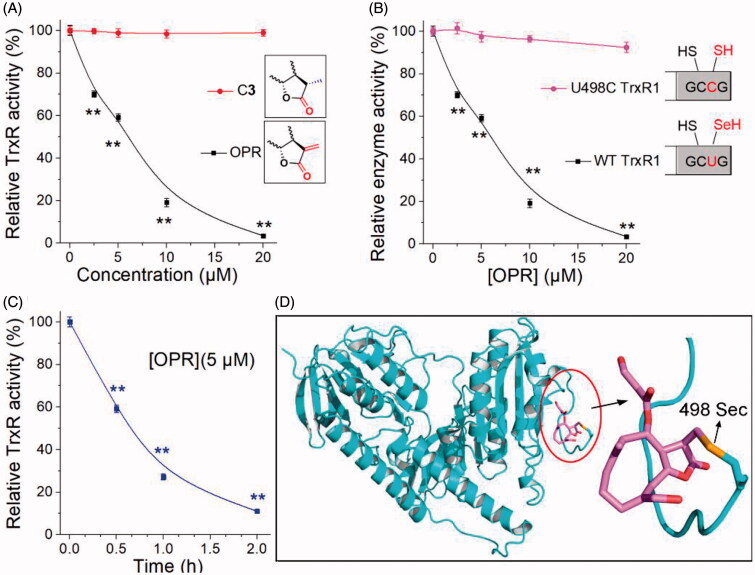
Figure 6.
Evidence for the interaction site between ONP and TrxR. (A) ONP and C3 selectively inhibited pure TrxR. (The illustration is the structural difference between ONP and C3). (B) Varying concentrations of ONP showed the difference in activity inhibition of WT TrxR and U498C TrxR1. (The illustration exhibited the difference between WT TrxR and U498C TrxR1). (C) ONP at a concentration of 5 μM inhibited the activity of pure TrxR in a time-dependent manner. The enzyme activities in (A), (B), and (C) are all detected by the DTNB method. The NADPH pre-reduced enzyme was incubated with different concentrations of ONP or C3 for 1 h, and then the enzyme activity in the system was detected by the DTNB method. (D) Covalent docking for ONP with the C-terminal site 498 of the chain A of the mouse TrxR1. The docking experiment was conducted using the covalent docking protocol in the SchrödingerSuite 2015-1 program. The monomer of TrxR1 is represented by a cyan cartoon. The interacting residues in the ONP and active site are shown in orange and purple sticks. Data are expressed as mean ± S. E. of three experiments. **p < 0.01 versus the control groups.

