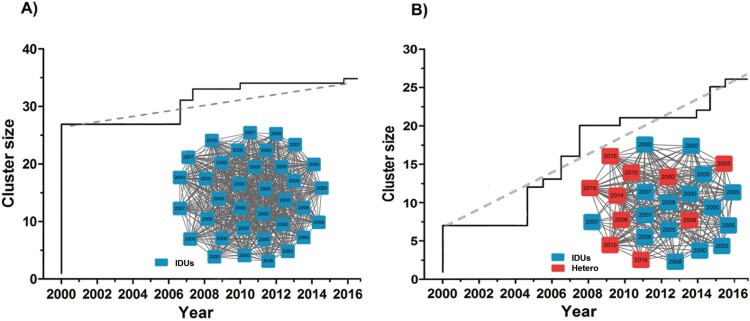
Figure 2.
Different cluster growth dynamics of CRF08_BC network. This image displays the two-growth pattern of the network. The X-axis time interval is year, the Y-axis is the value of the cluster size. Colour indicates different transmission risk factor. Abbreviations: Hetero, heterosexual; IDUs, intravenous drug users. The dotted grey line represents the straight line fitted by each point.

