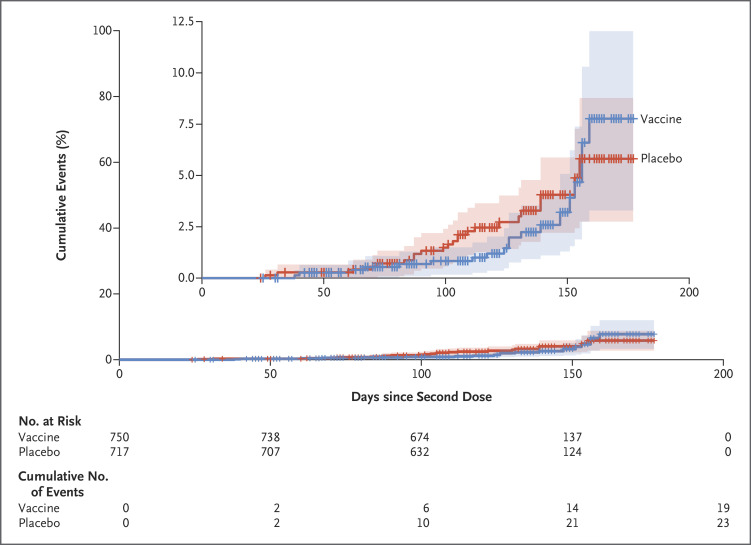
Figure 3. Kaplan–Meyer Plot of ChAdOx1 nCoV-19 Vaccine Efficacy against Symptomatic Covid-19 Illness of Mild or Moderate Severity after Two Doses, as Compared with Placebo.
The shading represents 95% confidence intervals. The tick marks indicate data censored at the time of one of the following events: a Covid-19 infection that did not meet the trial criteria for symptomatic Covid-19 illness, withdrawal from the trial, or death. The inset shows the same data on an expanded y axis.

