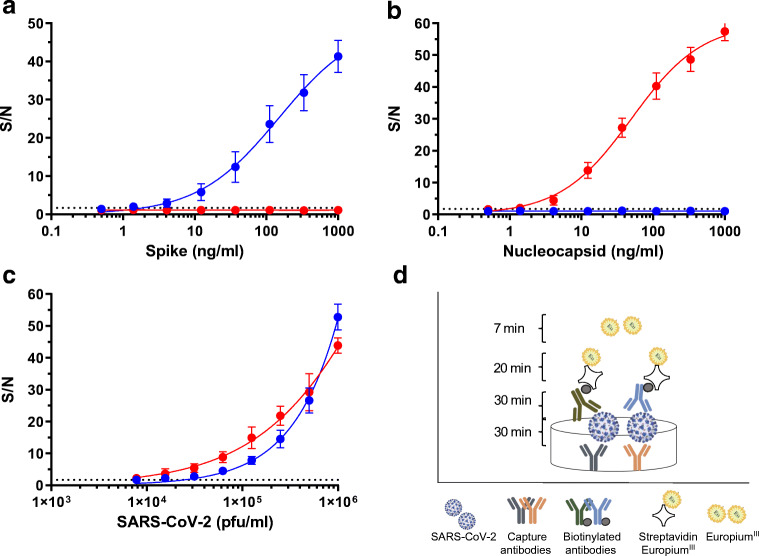
Fig. 2.
Specificity and sensitivity of TRF-based ELISA assays. Recombinant antigens a spike, b nucleocapsid, or c SARS-CoV-2 virus were diluted in PBS (0.5–1000 ng/ml or 2 × 10³–1 × 10⁶ pfu/ml) and analyzed with the NC-assay (red) or S-assay (blue). Signal-to-noise (S/N) ratios were calculated as described in “Materials and methods.” The dotted line represents the assay’s LOD. Nonlinear regression (performed using GraphPad Prism 6) yielded R square values of 0.99 for the curves presented in panels a, b, and c. d Schematic representation of TRF ELISA-based assays

