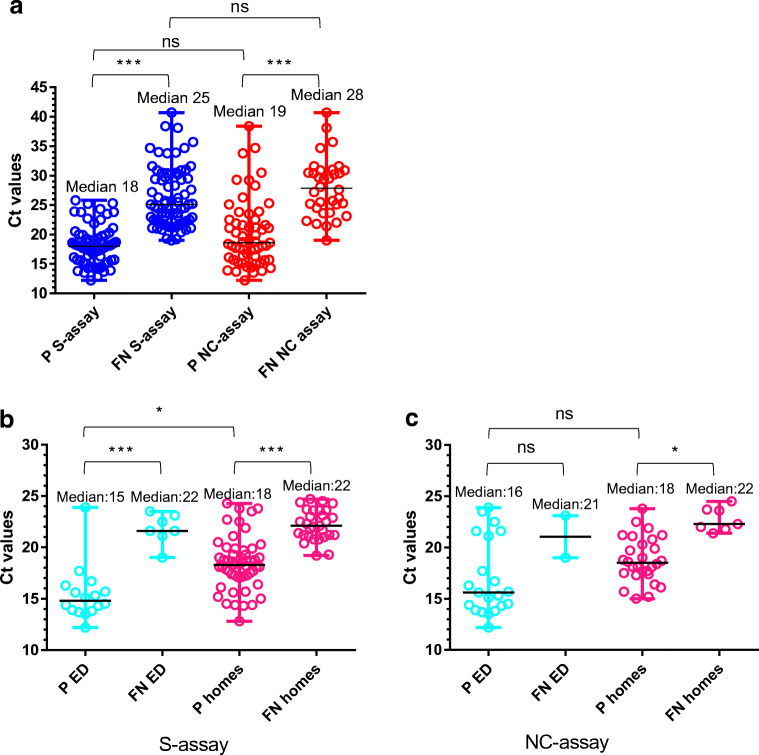
Fig. 4.
Comparison of viral loads (Ct values<25) among positive (P) and false negative (FN) results. a For the S- (blue) vs NC- (red) assays (for all qRT-PCR positive samples). For qRT-PCR positive samples from emergency departments (ED) (cyan) and nursing homes (homes) (pink) utilizing b S-assay; c NC-assay. Statistical analysis was performed using GraphPad Prism 6, applying one-way ANOVA test followed by Kruskal-Wallis multiple comparison tests. ns, not significant; *p < 0.05; ***p < 0.001

